
Looking Ahead This Week: September 28, 2026
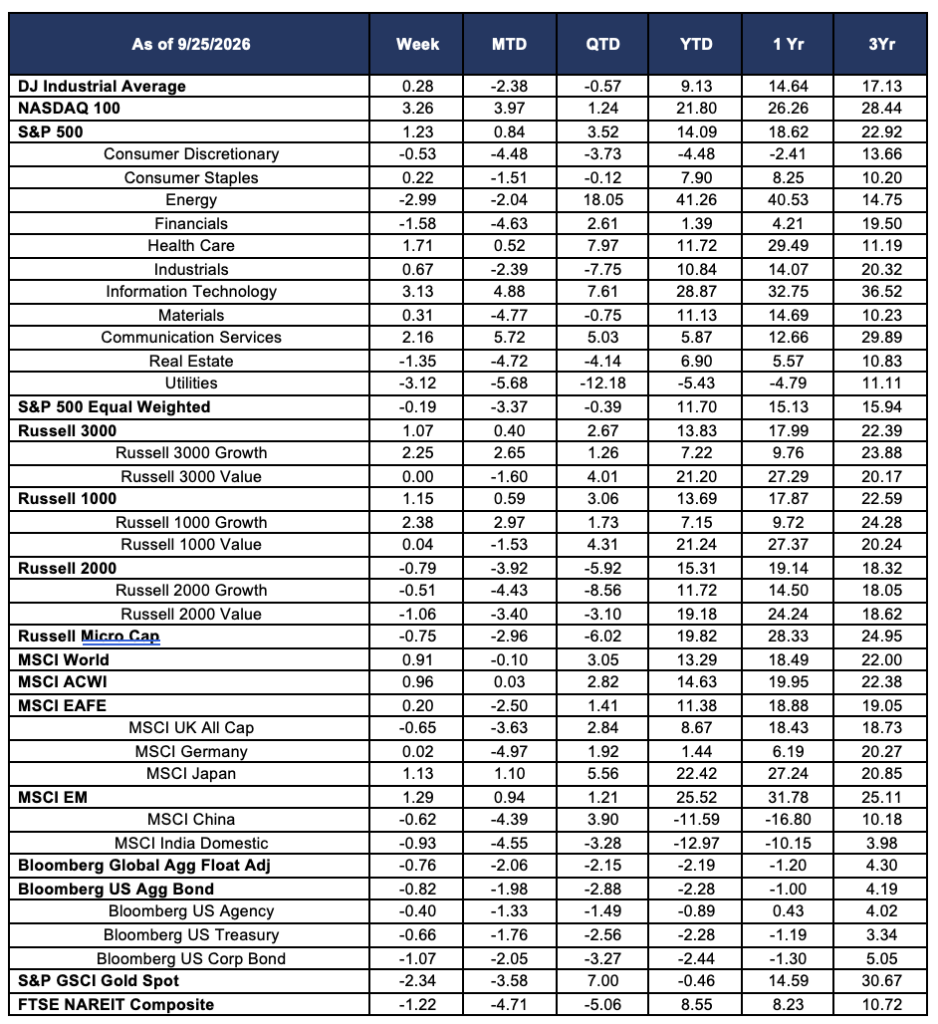
As Q3 closes, markets enter the fourth quarter navigating an extraordinary bifurcation that the third quarter has crystallized with unusual precision. On one side: Information Technology (+7.61% QTD), Health Care (+7.97% QTD), and a NASDAQ 100 that posted its first record high since June on the back of a week in which Meta’s new Muse AI assistant reached the top of Apple’s App Store and AMD crossed the $1 trillion market capitalization threshold for the first time. On the other: Utilities (-12.18% QTD), Industrials (-7.75% QTD), Real Estate (-4.14% QTD), and the Russell 2000 (-5.92% QTD) — a collection of rate-sensitive, capital-intensive, and domestically oriented businesses whose Q3 performance captures every consequence of a Federal Reserve that hiked 25 basis points and signaled it may not be finished. The week ahead will test whether the AI-driven rotation that drove this quarter’s winners can sustain momentum as the market transitions to Q4 earnings season, or whether the rate-sensitive overhang will reassert itself as the October FOMC meeting approaches.
The Strait of Hormuz diplomatic development on the sidelines of the United Nations General Assembly — Iran signaling a willingness to consider reopening the waterway within seven days as part of a phased agreement with the United States — is the single most consequential macro variable entering Q4. If credible, it would represent the most significant de-escalation of the year’s defining geopolitical story. The market’s initial reaction was visible in last week’s data: Energy fell -2.99% on oil’s four-day decline as traders priced the possibility of supply normalization. But the Mansfield Energy assessment is sobering — physical supply remains tight, Saudi Arabia is only beginning to restart its East-West pipeline after drone attacks halted it earlier this month, and Houthi activity continues to threaten alternative supply routes. The distance between Iran signaling and the Strait physically reopening could be measured in months, not days. Q4’s dominant question may be whether that gap closes fast enough to relieve the inflationary pressure that drove the Fed’s September hike — and whether a second hike before year-end can be avoided if it does.
Economic Data and Market Highlights: Week of September 22, 2026
Macro Backdrop
The week of September 22 produced the most consequential divergence of the third quarter in compressed form: a simultaneous AI-driven equity rally and an oil-driven energy selloff, connected by a common thread — the prospect of a geopolitical resolution that could reorder the market’s dominant themes of 2026 in a single week. The catalyst for the oil decline arrived on the sidelines of the United Nations General Assembly, where U.S. and Iranian negotiators held discussions that produced a report, first carried by regional energy media, that Iran may be willing to reopen the Strait of Hormuz within seven days as part of a phased agreement that would include easing of the U.S. economic blockade on Iran. Brent crude declined approximately 6% over the four days following the report, with WTI falling more sharply. The market’s energy positioning — built around nine months of thesis-confirming supply disruption — was forced to reprice a scenario it had largely stopped contemplating: a functioning Hormuz.
Simultaneous with the energy selloff, a separate AI-driven catalyst powered one of the technology sector’s best weeks of the year. Meta Platforms surged more than 11% on Monday, September 21 as its new Muse personal AI assistant reached the top of Apple’s App Store, generating downloads and engagement metrics that exceeded analyst expectations and validated the company’s multi-year investment in consumer AI infrastructure. The Muse launch triggered a broader semiconductor and AI chip rally: Arm Holdings rose more than 17% on the day, Intel gained approximately 12%, and Advanced Micro Devices surged roughly 10% — crossing the $1 trillion market capitalization milestone for the first time, a threshold that had appeared distant only months earlier when AI monetization skepticism was at its peak. The NASDAQ 100 hit its first record high since June, driven by the intersection of the AI catalyst, slightly retreating Treasury yields in the early part of the week, and a short-covering dynamic that accelerated the moves in the most heavily shorted technology names.
Domestic Equities
The S&P 500 gained +1.23% for the week, but the headline masked a divergence that was among the most extreme of the year. Information Technology surged +3.13% and Communication Services advanced +2.16%, propelled by Meta’s Muse-driven rally, the semiconductor surge, and renewed conviction in the AI monetization narrative that had faced persistent skepticism since Q2 earnings season. The NASDAQ 100’s +3.26% weekly gain brought its year-to-date return to +21.80% — the strongest of any major index — while the DJIA eked out only +0.28%, a 298-basis-point weekly spread between the two indices that captures the quarter’s defining dynamic in miniature: large-cap technology and AI-linked names accelerating while traditional industrial and value-oriented businesses stagnate in a high-rate environment. Information Technology’s year-to-date return of +28.87% and quarter-to-date gain of +7.61% now stand as the clearest expression of what 2026 has rewarded: companies whose revenue trajectories are driven by AI infrastructure demand rather than borrowing costs or consumer spending cycles.
The week’s most severe underperformance came, for the second consecutive week, from Utilities — falling another -3.12% to close Q3 with a -12.18% quarterly loss and a year-to-date return of -5.43%, the worst of any S&P 500 sector in 2026. The sector’s Q3 performance is the most telling indictment of what sustained rate pressure does to capital-intensive businesses: what began the year as a modest -2.38% YTD deficit at the end of Q2 has deepened dramatically as the Fed’s tightening cycle has progressed from theoretical to actual. Energy fell -2.99% for the week on the Hormuz diplomatic signal, ending Q3 with a still-extraordinary +18.05% quarterly gain and +41.26% year-to-date return — but the week’s drop was the sector’s largest in months and a reminder of how quickly the oil price narrative can reverse when diplomatic signals arrive. Financials declined -1.58% for the week (QTD +2.61%), Real Estate fell -1.35% (QTD -4.14%), and Consumer Discretionary slipped -0.53% to extend its position as the only other S&P 500 sector in negative year-to-date territory at -4.48%. The S&P 500 Equal Weighted index fell -0.19% against the cap-weighted index’s +1.23% gain — confirming that the week’s equity returns were concentrated in a handful of mega-cap technology names.
International Equities
International markets recovered modestly, with MSCI EAFE gaining +0.20% for the week as the AI-driven equity optimism and slightly retreating early-week Treasury yields provided marginal relief to dollar-sensitive international returns. MSCI Japan was the developed-market standout, gaining +1.13% to close Q3 with a +5.56% quarterly gain and a year-to-date return of +22.42% — one of the best performances among all major global equity markets in 2026 and a figure that reflects the durability of Japan’s structural corporate governance reform story alongside the currency dynamics that have periodically boosted yen-denominated equity returns for U.S.-dollar investors. MSCI Germany was essentially flat at +0.02% for the week, finishing Q3 with a +1.92% quarterly gain but a barely positive year-to-date return of +1.44% — one of the weakest among major developed markets and a reflection of the persistent headwinds from elevated European energy costs, dollar strength, and the industrial demand slowdown that has weighed on Germany’s export economy throughout the year.
Emerging markets gained +1.29% (MSCI EM) for the week, closing Q3 with a modest +1.21% quarterly return and an extraordinary +25.52% year-to-date gain that remains one of the market’s most underappreciated performances of 2026. The EM leadership continues to be driven by commodity-export-oriented economies across Southeast Asia and Latin America that have benefited directly from the same Hormuz-driven energy price environment that has punished importers. MSCI China fell -0.62% for the week and is now -11.59% year-to-date, with the twelve-month loss deepening to -16.80% — figures that capture the compounding of domestic economic headwinds, geopolitical risk premium, and the structural energy import cost burden from the Hormuz disruption. MSCI India Domestic declined -0.93% for the week (YTD -12.97%), continuing to carry the dual burden of energy import costs and currency weakness that has made it the year’s worst-performing major market by a widening margin. The Hormuz diplomatic signal, if it develops into a genuine reopening, would have more immediate positive implications for India and China than for almost any other major market — a point that may explain why both declined only modestly despite the uncertain diplomatic backdrop.
Fixed Income
Fixed income markets continued to deteriorate, with the Bloomberg US Aggregate Bond Index falling -0.82% for the week — one of its largest single-week declines since the April tightening shock — as the 10-year Treasury yield pushed above 5% during the week, reaching its highest levels since 2007 at certain intraday points before settling back. Bloomberg US Corporate Bonds declined -1.07%, the largest weekly decline among fixed income sub-categories, as credit spreads widened to reflect growing concern about the economic implications of sustained elevated borrowing costs in the wake of the FOMC’s hike and the dot plot’s hawkish forward signal. Bloomberg US Treasuries fell -0.66% and the US Aggregate closed Q3 with a -2.88% quarterly loss and a year-to-date return of -2.28% — a result that reflects the full arc of 2026’s fixed income challenge: a market caught between improving core inflation data and an energy supply shock that has kept headline pressure elevated, with a Fed that ultimately chose to act on the totality of the picture rather than wait for energy prices to normalize on their own.
The Bloomberg Global Aggregate Float Adjusted index fell -0.76% for the week and closed Q3 at -2.15% quarterly and -2.19% year-to-date — confirming that the bond market’s difficulties in 2026 are not uniquely American but reflect a global repricing of the interest rate environment as central banks that had waited for the Fed now follow its lead. The Bloomberg US Agency index, at -0.89% year-to-date, has held up substantially better than the corporate bond universe at -2.44% YTD — a spread that reflects both the credit quality differential and the duration extension that corporate issuers undertook during the low-rate era and are now carrying into the current tightening cycle at considerable cost. The Hormuz diplomatic signal, if it leads to meaningful oil price declines, would provide the bond market with its most credible potential catalyst for relief — lower energy prices reducing headline CPI, reducing the justification for the second hike the dot plot has signaled, and allowing the yield curve to stabilize at levels that would mark a genuine Q3-to-Q4 inflection.
Alternatives & Commodities
Gold fell -2.34% for the week — its largest single-week decline in months — as the Iran-Hormuz diplomatic signal delivered a simultaneous blow to two of gold’s primary supports: the geopolitical risk premium that had anchored the metal’s safe-haven bid, and the oil-driven inflationary overhang that had bolstered the case for monetary hedging. The result pushed gold’s year-to-date return into negative territory at -0.46%, erasing the gains that had accumulated through the summer’s extraordinary surge and partial recovery. Gold’s quarter-to-date return of +7.00% captures the metal’s August peak performance, but the trajectory since late August has been consistently lower as the combination of a delivered Fed hike, a hawkish dot plot, and now nascent Hormuz optimism has stripped away the conditions that made gold’s bull case most compelling. The metal’s sensitivity to the Hormuz situation is direct: a genuine reopening of the waterway would remove the geopolitical risk premium, reduce the energy-driven inflation narrative, and reduce the urgency of monetary hedging — all simultaneously.
Energy’s -2.99% weekly decline — driven by Brent crude’s approximate 6% four-day drop on Hormuz diplomatic optimism — was the sector’s most significant single-week pullback since the conflict began. The selloff reduced Energy’s year-to-date return from the extraordinary +45.61% recorded the prior week to +41.26%, and the Q3 final return of +18.05% remains the most powerful quarterly sector performance in the S&P 500 in 2026. The nuance in the energy picture is important: the Mansfield Energy assessment that physical supply remains tight — Saudi Arabia’s East-West pipeline restart is only in its early stages, Houthi attacks on Saudi infrastructure continue, and the Hormuz channel itself remains physically constrained regardless of diplomatic signals — suggests that the oil price move may reflect sentiment ahead of fundamentals. A seven-day reopening timeline, if Iran’s signal is genuine, would represent an unusually rapid de-escalation of a conflict that has evolved over nine months of complex multilateral negotiations. Real estate investment trusts (FTSE NAREIT Composite) fell -1.22% for the week and closed Q3 with a -5.06% quarterly loss, the sector’s worst quarterly performance of the year, as the combination of the Fed’s actual rate hike and the signaled forward path made a near-term yield relief catalyst structurally implausible heading into Q4.
Source: Morningstar. Market data as of September 25, 2026. Past performance is not indicative of future results. The information provided is for educational and informational purposes only and does not constitute investment advice.