
Economic Data Watch and Market Outlook
The US Federal Reserve left rates unchanged on Wednesday but indicated that another rate increase is likely before the end of the year. GDP results are released later this week and the Fed indicated that they are increasing their growth expectations for the year. Global equity markets reacted by dropping for the week as the MSCI World fell 2.73% and the S&P 500 plunged 2.91%. The US Aggregate Bond Index fell 50 basis points.
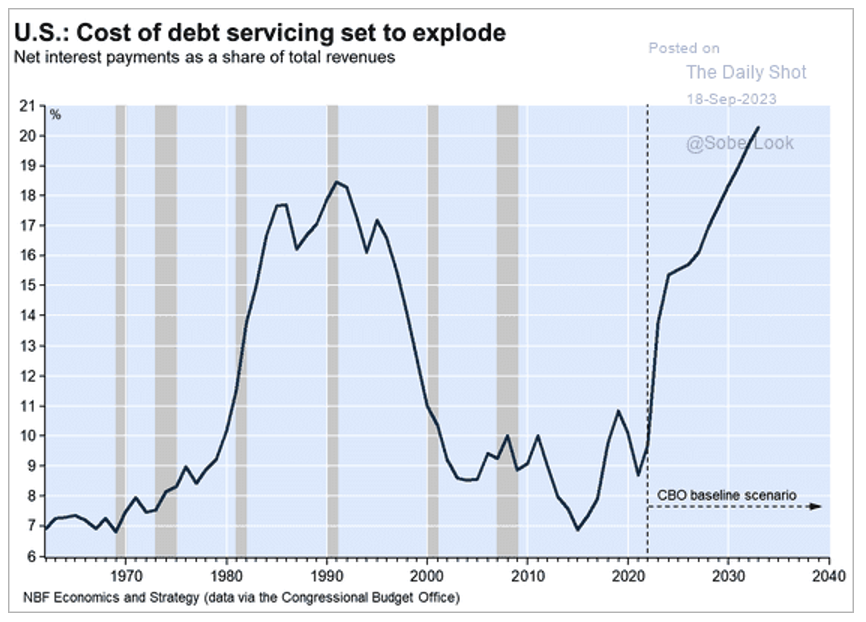
Higher for longer not only impacts consumers and businesses, but has significant effects on the future of the US government’s debt and the interest payments on that debt as the chart below shows.
Despite the US GDP growth being revised upward, there are headwinds including rising oil prices, the potential for a prolonged United Auto Workers strike, the resumption of student loan payments in October, and the potential for a government shutdown.
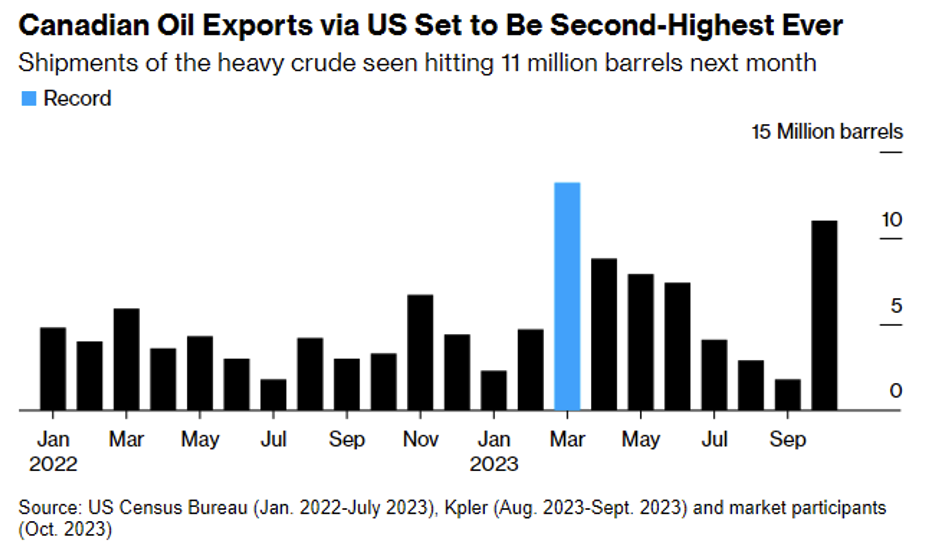
Canadian oil exports are expected to reach 11 million barrels in October, the second highest level on record, which is a 6x increase from September exports. Refineries in the US are typically some of the largest importers of Canadian oil, but have been carrying out planned maintenance, which has in turn opened up more barrels for buyers in Asia and Europe. As oil supplies are being squeezed by Saudi and Russian producers, the demand for Canadian oil has only been exacerbated. On Wednesday, September 27th, the Energy Information Administration’s (EIA) will release data about US crude stockpiles, as well as a host of other information related to the state of fossil fuels. The average gasoline price in the US, according to AAA, stood at $3.847 at the time of this writing.
The UAW continues to roll out strikes against GM and Stellantis at 38 facilities but not yet at Ford where the UAW noted that there has been some progress. The UAW is hoping for a roll back of the two-tier wage system and implementing a cost of living adjustment, both of which were implemented to assist the Big Three after the Great Financial Crisis in 2009 required a bailout. As of Friday, the big three had roughly 58 days of inventory and the UAW’s strike fund was well funded. The UAW plans to roll out strikes at new plants weekly until a deal is reached.
Student loan payments are set to resume in October after a pause and several extensions from the Trump and Biden administrations. Interest began accruing again on September 1st. There are however, protections in place that eliminated the possibility of default or late payments being reported to credit agencies until October 24th. There is approximately $1.7 trillion in outstanding student loan debt of which the Biden administration attempted to eliminate approximately $430 billion. The hotly political issue was ultimately struck down by the Supreme Court.
The start of the US fiscal year begins on October 1st but the House has been unable to move forward as several members held up the process due to the funding for the war in Ukraine. Roughly 4 million government employees could have their paychecks deferred should the shutdown occur.
The upcoming week is a big week for data releases. As noted above, on Wednesday, we’ll hear a great deal about the status of US energy stockpiles and production but durable goods and mortgage data will also be released. Thursday, US GDP, jobless claims, PCE data, and consumer spending data will be released. Friday, more PCE data, trade balance results, and personal spending data will be released. Michigan consumer sentiment survey data will also be released Friday.
Equities
For the week the Dow Jones Industrial Average dropped (-1.9%), the S&P 500 fell (-2.9%), the Nasdaq fell
(-3.6%), and the Russell 2000 dropped (-3.8%). This week the S&P 500 marked 100 days without a greater than 1.5% drop which is the first time since 2018 but that ended Thursday as it fell (-1.6%) marking its worst day since March. Heavy selling was seen after the Fed’s median projection saw only 50 basis points of cuts in 2024 which is down from 100 basis points in June. The S&P 500 hit its most oversold level of the year this week at more than two standard deviations below its 50-day moving average.
Consumer spending stocks took some of the biggest hits as restaurants, casinos, and housing stocks fell the most amongst industry groups. The consumer discretionary, REITs, and financials sectors were the biggest losers during the week dropping over (-4.5%). The Regional Bank ETF symbol KRE fell (-5.8%) as banks continue to manage a higher rate environment and larger consumer loan losses. Crude oil remains high trading above $90 a barrel despite some concerns for a slowdown. Following three consecutive days of losses, the S&P 500 and Nasdaq saw a brief rally early Friday before closing negative for the third straight week while the Dow Jones Industrial Average was lower for the second straight week. US equity funds had outflows of $7.8 billion for the period ending 9/20/23 compared to inflows of $10.5 billion in the prior period.
Activision Blizzard, Inc, rose following the UK announcing that Microsoft’s revised proposal to modify its acquisition makes it a possibility for the $75 billion dollar deal to be cleared. This revision would allow Activision to sell cloud gaming rights to French video game publisher Ubisoft Entertainment as shares rose 3.5 % following the news. Amazon rose 1.6% after it announced it intends to add advertising to Prime Video next year.
The IPO market has seen some uptick in activity as bigger names such as ARM, Instacart, and Klaviyo all came to market this month with mixed performance. Arm is down roughly (-15.5%) over the past week and short sellers are beginning to make bets on the stock, making up roughly 5% of the company’s available shares. Instacart is down approximately (-28.6%) from its opening price and Klaviyo is down roughly (-9.1%) from its opening price. The volatility is mostly because all three companies had fewer shares to trade upon their debut of 7.5% to 10% compared to the 5-year average of 20%. In the coming months lockups will end for early investors which could cause more price volatility.
Chinese stocks were boosted slightly Friday as Alibaba, electric vehicle maker NIO Inc., and ecommerce JD.com Inc. all saw increases in stock prices. The Hong Kong Hang Seng Index closed Friday +2.2% following a two day sell off that brought the index to its lowest point this month. Reports out Friday signaled that China is considering relaxing rules around foreign ownership of publicly traded firms. International stocks outperformed the US this week and developed markets were slightly stronger than emerging but still in the red. The MSCI EM index was down (-2.1%) while the MSCI EAFE was down (-2.0%) and the MSCI Europe was down (-1.9%).
Fixed Income
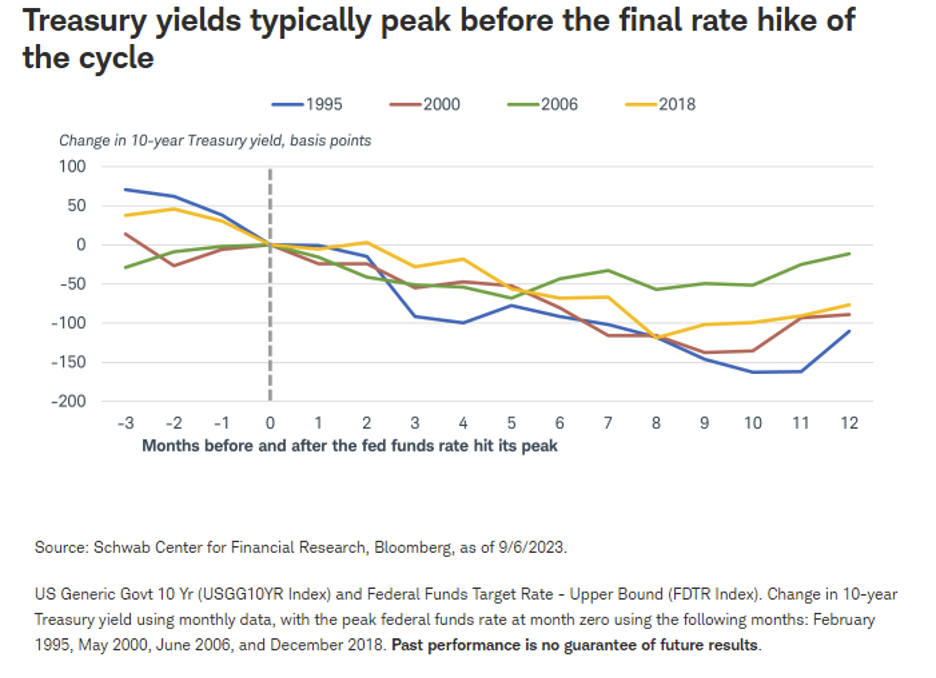
The Federal Reserve met Wednesday for their September meeting, ultimately leaving rates flat. The Federal Funds target rate currently sits between 5.25% and 5.50%. Shorter term yields are currently sitting near cycle highs while intermediate and longer-term bond yields have been floating in a broader range over the past month. Treasury yields rose across the board this week with the 2-year Treasury yield climbing 8 bps, the 10-year Treasury yield rising 11 bps, and the 30-year Treasury yield rising 11 bps as well. Charles Schwab is predicting that the Fed is done hiking rates, citing the fact that in the past four rate hike cycles the 10-year Treasury yield has peaked before the last rate hike and then trended lower. Conversely, trading volume on Fed Funds futures has jumped significantly in the past week, pointing to the idea that the Federal Reserve is more likely to raise rates in December than November. Meanwhile bond indices fell, with the Bloomberg US Aggregate Bond Index falling -0.50%, the Bloomberg US Corporate High Yield Index falling -0.65%, and the Bloomberg US MBS Index falling -0.71%.
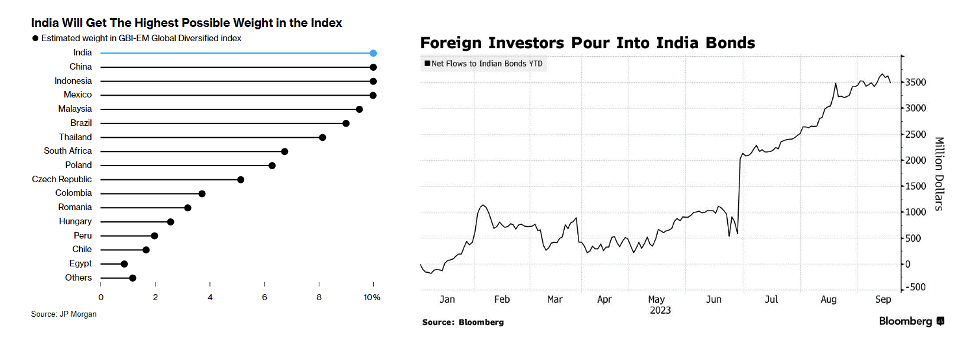
India has seen large flows of ~$3.5B into their debt market this year, making them a standout in a generally struggling emerging debt market. JPMorgan has made a significant announcement that it will add Indian government debt to its benchmark emerging-market index starting in mid-2024. The move is a positive for India, representing greater connectivity to global markets and the potential for lower borrowing costs in the future. Currently 23 bonds, worth a combined notional $330 billion, are eligible to be added to the JPMorgan Government Bond Index – Emerging Markets. The new inclusion of these bonds will be staggered throughout a 10-month period starting June 28, 2024 at around 1% a month, giving India the largest possible weighting in the index alongside China, Indonesia, and Mexico. Goldman Sachs expects this new inclusion to lead to up to $40B in inflows into India’s bond markets over the next 18 months, with approximately $30B of passive inflows, and $10B of active inflows due to the countries attractive yield and volatility metrics. According to Goldman Analyst Danny Suwanapruti, flows will be frontloaded and begin immediately as investors attempt to pre-position for the inclusion taking place next year.
Hedge Funds – As of Thursday, September 21st
The S&P posted its largest daily decline since March on Thursday, bringing the week to a challenging close for global indices. However, the average global hedge fund (HF) held up well as they captured only 10% of the downside in the index as they were down 30 bps (vs. MSCI World -2.6%). Equity long/short (L/S) managers captured more of the downside but only lost ~70 bps WTD. US L/S equity funds were similarly down ~70 bps (vs. S&P 500 -2.7%).The relatively stronger performance compared to previous weeks, where HFs experienced over 50% of the downside, can be largely attributed to stronger short alpha. The top 50 crowded shorts in North America (NA) were down 4.3% (vs. top 50 crowded longs -3.2%). Performance across other regions held in well as the average EU-based fund similarly experienced ~15% of the downside as they lost ~10 bps (vs. Euro STOXX 600 -1.5%), while the average Asia-based HF lost slightly more declining 80 bps vs. MSCI Asia -2.7%.
HFs were net sellers of global equities this week driven largely by the short side. In NA, equities flow made up 70% of the overall net selling, as the selling in the region ended as the 4th largest week of selling seen YTD and the largest WoW decrease in US L/S net leverage since October 2022. Going in more detail, HFs added back to index-level hedges and trimmed long exposure from ETFs in a 60/40 split with activity at the sector level far quieter in notional terms. That said, TMT-related names continued to lead the net selling as HFs continued adding shorts across mega-cap TMT and AI beneficiaries while trimming longs in lighter amounts. Positioning continues to remain relatively extended compared to historical levels, though it has meaningfully come down from peaks seen in mid-August. Healthcare was also net sold via HC equipment & supplies, though HFs also added shorts and trimmed longs in HC tech and HC providers and services. On the flip side, HFs continued to tilt towards buying consumer staples as they added longs and covered shorts in household products and distribution & retail. HFs also continued to rotate long exposure into under-owned pockets of the market including materials, financials, and utilities.
Looking outside the US, Europe was the only region to be net bought last week, though the bulk of the buying was driven by multi-strategy/macro and event driven funds while equity L/S and quants were net sellers. The flow was largely led by financials, where HFs were buyers of all industries in the sector except for consumer finance. HFs were also net buyers of tech and consumer staples, with HFs adding across most industries within both sectors. Energy shorts were covered in oil, gas & consumable fuels. HFs were sellers of healthcare, and unlike NA, they were also sellers of materials, utilities, industrials. In Asia, HFs were large net sellers of AxJ driven by China, South Korea and Taiwan with the selling in China concentrated in consumer discretionary and tech, with positioning to both sectors continuing to track near multi-year lows. Japanese stocks were net sold on the week as hedge funds actively unwound risk into the BoJ meeting. This week’s notional de-grossing activity in Japan, long and short combined, was the largest since 2021.
Private Equity
Fundraising for venture investors has become increasingly challenging, prompting firms to seek ways to stand out and secure commitments. One approach has been for firms to specialize in specific sectors, leading to a rise in specialist vehicles, accounting for 26.4% of overall VC fund count in 2021, compared to 22.2% in 2014.
Pitchbook’s analysis of specialist vs. generalist VC fund performance encompassed 1,824 VC funds with vintages spanning from 2000 to 2020. While Pitchbook did not cite a significant difference in overall performance between the two styles, specialist funds outshine generalists in terms of Total Value to Paid-In Capital (TVPI). Specialist funds tend to adopt longer investment horizons, particularly in areas like biotech and deep tech, which results in appreciating investments over time. Startups in specialized sectors may require more early-stage capital for commercialization, spreading returns over time.
Regarding Internal Rate of Return (IRR), the most recent cohort of funds (2015 to 2020) demonstrates better performance for specialists. Generalists benefit from diversification, which enhances risk spreading and captures opportunities across sectors, potentially leading to more stable IRR. Pitchbook cited that specialist funds, especially those under $250 million, excel in terms of both IRR and TVPI. Their focus on earlier stages allows them to build deep knowledge and expertise, facilitating the identification of promising startups and niche market trend assessment. For funds exceeding $250 million, recent generalist funds show a nearly 5 percentage point lead in IRR over specialist counterparts. Larger funds have more resources to allocate to specific sectors, and they often target later-stage investments, requiring less in-depth knowledge.
The shift towards higher IRR for generalist funds may be attributed to the VC deal making boom that began around 2017-2018 when valuations soared. Specialist funds show a slightly higher TVPI, but the difference is marginal. The long-term nature of specialist fund investments favors TVPI, but the recent IRR advantage of generalists during a bull market may attract more investors to their side.
Analysts believe it remains to be seen if generalists can maintain their position in the face of the current economic downturn, as their IRR lead emerged primarily in the latest cohort, coinciding with a favorable VC market.
Authors:
Jon Chesshire, Managing Director, Head of Research
Elisa Mailman, Managing Director, Head of Alternatives
Katie Fox, Managing Director
Mike McNamara, Analyst
Sam Morris, Analyst
Data Source: Apollo, Barron’s, Bloomberg, BBC, Charles Schwab, CNBC, the Daily Shot HFR (returns have a two-day lag), Goldman Sachs, Jim Bianco Research, Market Watch, Morningstar, Morgan Stanley. Pitchbook, Standard & Poor’s and the Wall Street Journal.