
Looking Ahead This Week: September 21, 2026
The Federal Reserve has spoken. With a unanimous 12-0 vote to raise the federal funds rate 25 basis points to a target range of 3.75%-4.0%, Chair Warsh delivered the first rate increase in three years — and then delivered a second message that may matter more for markets than the hike itself. The updated Summary of Economic Projections showed 16 of 18 FOMC participants anticipating at least one additional hike before year-end, a notably hawkish distribution that makes the November and December meetings genuinely live events. Warsh’s press conference framing — that inflation has been “too high for too long” and that the committee has not yet satisfied its standard for confidence that underlying inflation is moving to target “clearly and at sufficient speed” — removed any ambiguity about the Fed’s posture. Markets now face a policy environment in which the rate ceiling is not yet visible.
This week the market’s attention will pivot to the incoming data that will determine whether the dot plot’s hawkish signal materializes into another hike. The energy sector’s extraordinary year — Energy is now +45.61% YTD on the back of a Strait of Hormuz supply shock that has refused to resolve — continues to embed inflationary pressure in the headline CPI basket that core measures cannot fully insulate. With the FOMC having hiked rather than held, and the dot plot pointed toward additional tightening, September’s rate-sensitive equity sectors — Utilities at -9.35% quarter-to-date, Industrials at -8.36% QTD, Real Estate at -2.84% QTD — face a difficult fundamental backdrop as Q3 draws to a close. The question heading into the final week of the quarter is whether the market’s remarkable bifurcation — large-cap technology and AI-linked names holding up while rate-sensitive sectors deteriorate — can be sustained through another potential hike cycle.
Economic Data and Market Highlights: Week of September 15, 2026
Macro Backdrop
The week of September 15 delivered the most anticipated Federal Reserve decision in years, and the outcome — a unanimous 12-0 vote to raise the federal funds rate by 25 basis points to a target range of 3.75%-4.0% — was historic on multiple dimensions. It marked the first rate increase since 2023, the first tightening action of Chair Warsh’s tenure, and the first rate decision on which the full committee voted unanimously since the early stages of the current cycle. The August CPI report, released Monday before the FOMC entered its formal deliberations, provided the final data point the committee needed: headline inflation ticked up modestly on the back of elevated energy prices, while core CPI held near the cycle’s low of 2.5% annually — a combination that gave hawks the argument that the energy-driven inflationary overhang remained a risk worth addressing while allowing the broader committee to act with confidence rather than urgency. The 10-year Treasury yield, which had been hovering just below 5% in the days leading into the decision, remained elevated throughout the week as markets digested both the hike and the implications of the hawkish dot plot.
Warsh’s post-meeting press conference was as consequential as the rate decision itself. His statement that the FOMC “decided that this standard has not been satisfied” — referring to the committee’s threshold for confidence that inflation is durably returning to target — signals a policy framework that is data-dependent in the forward direction but does not offer the comfort of a rate cut horizon in the near term. The 16-of-18 dot distribution pointing toward additional tightening, combined with Warsh’s noted decision not to submit a personal dot since taking office, left markets unable to assign a clear Fed chair opinion to the forward path — preserving optionality in both directions but offering less clarity than investors in rate-sensitive assets would prefer. The Friday session was additionally complicated by a triple-witching expiration event — the simultaneous expiration of stock options, index options, and futures contracts that occurs quarterly — which amplified intraday volatility and contributed to the week’s disperse return patterns across sectors and market capitalizations.
Domestic Equities
The S&P 500 managed an essentially flat week at -0.06%, a deceptively calm headline that obscured dramatic divergences beneath the surface. The DJIA fell -1.65% — its third consecutive losing week and worst performance since March — while the NASDAQ 100 gained +0.95%, a spread of nearly 260 basis points that represents one of the widest Dow-versus-NASDAQ divergences of the year. The pattern reflects the market’s internal logic in a rate-hiking environment with a hawkish forward path: the Dow’s heavy weighting toward financials, industrials, and traditional value-oriented companies creates direct exposure to the economic sensitivity of higher rates, while the NASDAQ 100’s concentration in large-cap technology names benefits from the AI monetization narrative that has provided a durable earnings floor regardless of the rate backdrop. Information Technology gained +1.06% and Communication Services advanced +1.15% on the week, both benefiting from investor rotation toward companies whose growth trajectories are perceived as rate-resistant. Health Care was the week’s best-performing sector at +1.85%, extending a pattern of defensive positioning as investors sought protection against the uncertain economic outlook that follows a rate hike with additional tightening signaled.
The week’s most dramatic underperformance came from Utilities, which fell -3.02% — bringing the sector’s quarter-to-date loss to -9.35% and its year-to-date return to -2.38%, making it the worst-performing S&P 500 sector of 2026. The calculus is mechanical and unforgiving: utilities are among the most capital-intensive businesses in the market, rely on external debt financing to fund infrastructure investment, and pay dividend yields whose attractiveness relative to Treasuries erodes directly as yields rise. With the 10-year Treasury near 5% and the FOMC signaling more to come, the sector faces a borrowing cost environment that compresses both earnings and valuations simultaneously. Real Estate fell -1.97% for the week and is now -2.84% for the quarter, for the same reasons at scale. Financials declined -2.33% as the initial enthusiasm about higher net interest margins gave way to concern about credit quality deterioration in a slowing economy. Industrials fell -1.52%, pushing the sector’s quarter-to-date loss to -8.36% — the worst quarterly performance among major sectors in 2026 and a figure that reflects the compounding effect of rate sensitivity, geopolitical energy cost pressure, and weakening capital expenditure appetite. The S&P 500 Equal Weighted index fell -1.20% for the week against the cap-weighted index’s -0.06%, a spread that captures precisely the degree to which mega-cap technology is carrying the broader market while the average constituent deteriorates.
International Equities
International developed markets declined modestly, with MSCI EAFE falling -1.58% for the week as the Fed’s rate hike reinforced dollar strength and compressed international returns for U.S.-based investors. MSCI Germany was the week’s most significant developed-market underperformer at -2.11%, pushing its year-to-date return to a meager +1.43% — the weakest among major developed markets tracked — as the combination of a stronger dollar, elevated European energy costs from the ongoing Hormuz supply disruption, and sensitivity to global industrial demand weighed on Germany’s export-oriented economy. MSCI UK All Cap declined -1.03% and MSCI Japan fell -1.20%, though Japan’s year-to-date return of +21.04% continues to stand among the strongest of any major developed market, reflecting the structural corporate governance reform story that has attracted sustained foreign institutional capital throughout 2026. The yen’s modest strengthening against the dollar in the wake of the Fed hike — a natural response to the narrowing in short-term rate differentials — provided a modest headwind for Japan’s export sector on a currency-adjusted basis.
Emerging markets held up relatively well at -0.55% for the week (MSCI EM), with the asset class’s extraordinary 2026 performance (+23.92% YTD) reflecting the degree to which commodity-export-oriented economies have benefited from the same Hormuz-driven energy supply shock that has punished energy-importing nations. MSCI China fell only -0.17% for the week — one of its better relative performances of the year — though its year-to-date loss of -11.04% and its deeply negative twelve-month return of -15.77% capture the compounding effects of China’s domestic headwinds: a property sector that has stabilized but not recovered, persistent geopolitical risk premium, and the elevated cost of energy imports through a constrained Strait of Hormuz. MSCI India Domestic declined -0.58% for the week and is now -12.15% year-to-date, confirming its position as the worst-performing major market of 2026 — a striking reversal from India’s pre-conflict standing as the world’s most favored emerging market growth destination, driven by the intersection of energy import costs, currency pressure, and domestic inflationary persistence that the country’s monetary authorities have struggled to contain.
Fixed Income
Fixed income markets absorbed the Fed’s rate hike with notable resilience, with the Bloomberg US Aggregate Bond Index declining only -0.03% for the week — a near-flat result that reflects the degree to which the 25-basis-point hike had been fully priced into bond markets before Wednesday’s announcement. Bloomberg US Treasuries fell -0.10% and corporate bonds gained a modest +0.13%, with the latter benefiting from a marginal tightening of credit spreads that reflected relief that the hike arrived at the lower end of what markets had been pricing in previous weeks. The 10-year Treasury yield’s persistence near 5% throughout the week underscored the bond market’s principal concern: not the September hike itself, but the forward path implied by a dot plot showing 16 of 18 officials anticipating additional tightening. For fixed income investors, a fully-priced hike that is accompanied by guidance toward more hikes is the least favorable possible scenario — the current hike provides no relief, and the forward guidance prevents a duration rally.
The Bloomberg US Aggregate Bond Index’s quarter-to-date loss has deepened to -2.07% and its year-to-date return stands at -1.46%, a persistent negative that reflects the challenging interest rate environment that has characterized 2026 from the beginning of the year. The Bloomberg Global Aggregate Float Adjusted index fell -0.58% for the week as international sovereign bond markets, having anticipated the Fed’s action, now price an extended higher-rate environment across developed market central banks that have broadly tracked the Fed’s trajectory. The dispersion between the US Agency index (-0.50% YTD) and the US Corporate Bond index (-1.39% YTD) captures the credit quality dimension of the story: agency paper has held up considerably better than corporates as the tightening cycle has progressed, a pattern consistent with historical credit cycle behavior in which investment-grade spreads widen modestly as economic uncertainty increases and rate-sensitive borrowers face higher refinancing costs.
Alternatives & Commodities
Gold advanced a modest +0.36% for the week — a conspicuously subdued response to a Fed rate hike that historically has provided tailwinds for the metal through its impact on real yields and dollar dynamics. The muted reaction likely reflects the degree to which the September hike was priced into gold ahead of the meeting: the metal had already given back the bulk of its August surge in the weeks following the strong September 4 jobs report, and a hike that arrived alongside a hawkish dot plot — rather than the kind of policy pivot that would have provided fresh support — offered no new catalyst for a meaningful rally. Gold’s year-to-date return of +1.93% and its quarter-to-date gain of +9.57% represent very different stories: the QTD figure captures gold’s extraordinary August surge from the July labor market shock, while the modest YTD figure reflects both the prior summer’s -6% trough and the partial recovery. The FOMC’s decision to hike with additional tightening signaled reinforces the near-term headwinds for gold from a rising real yield environment.
Energy fell -1.24% for the week — a modest pullback after months of relentless advance — as oil prices eased slightly in the days following the FOMC decision, with the rate hike interpreted by some participants as a demand-side headwind that could marginally offset the supply-side pressure from the Strait of Hormuz disruption. The sector’s year-to-date return of +45.61% and its quarter-to-date gain of +21.69% require no additional context: Energy has been the singular investment theme of 2026, and every pullback in the sector has proved temporary as the physical constraint on Hormuz oil flows has persisted regardless of diplomatic activity. Real estate investment trusts (FTSE NAREIT Composite) fell -1.96% for the week and are now -3.89% quarter-to-date — their worst quarterly stretch of the year — as the rate hike and hawkish forward guidance removed any near-term catalyst for the yield-compression relief that REIT valuations require. The sector’s year-to-date return of +9.90% retains its positive standing, but the trajectory since the Fed’s tightening pivot has been consistently negative, and the path to further gains requires a policy inflection that the dot plot suggests is not imminent.
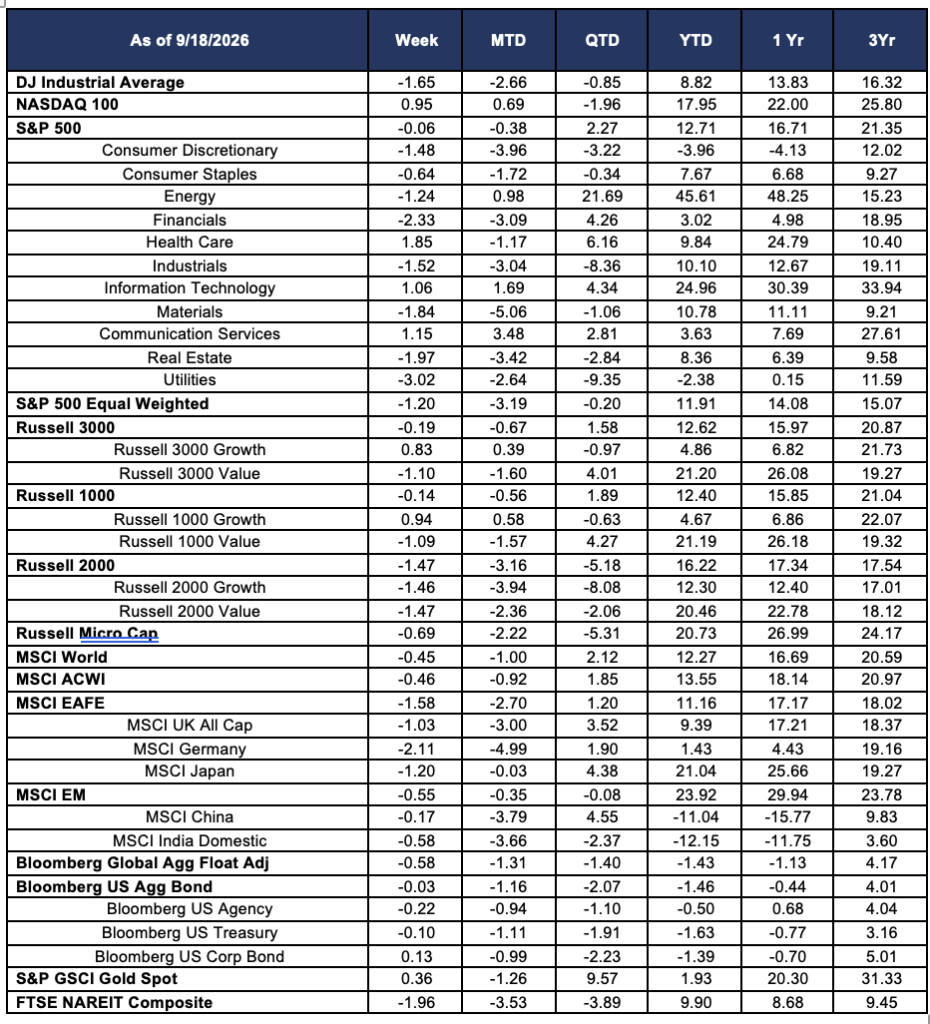
Source: Morningstar. Market data as of September 18, 2026. Past performance is not indicative of future results. The information provided is for educational and informational purposes only and does not constitute investment advice.