
Economic Data Watch and Market Outlook
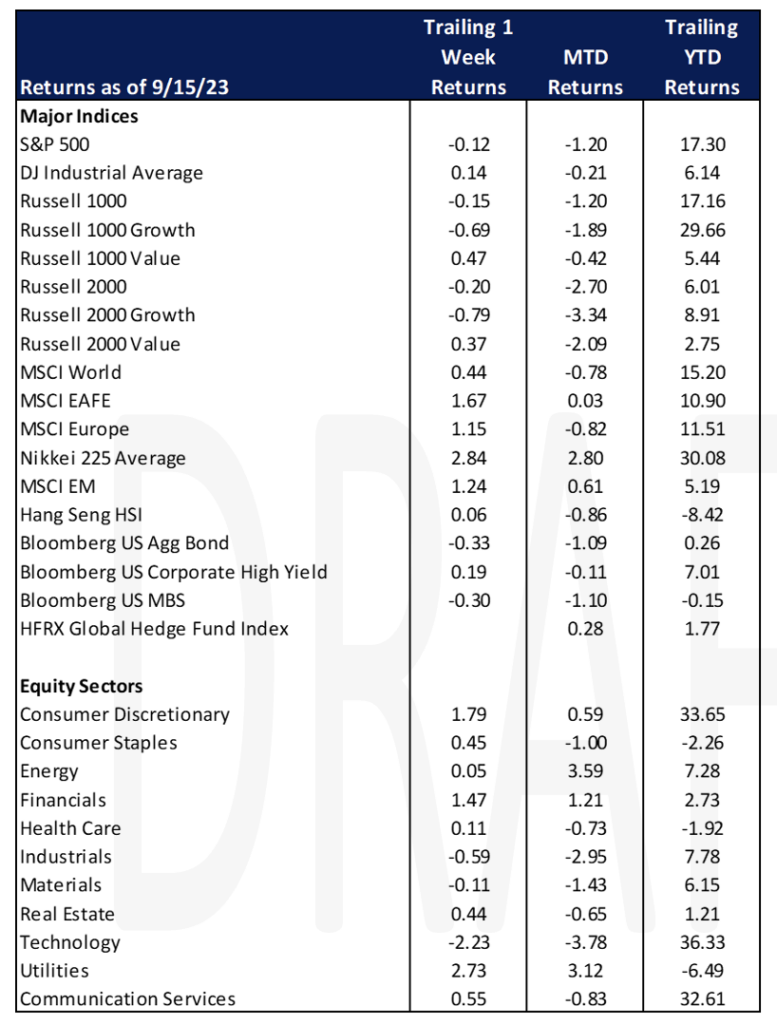
Global asset prices were mixed this past week as US equities were relatively flat while international and emerging market equities increased over 1%. The Bloomberg US Aggregate Bond Index fell 33 basis points.
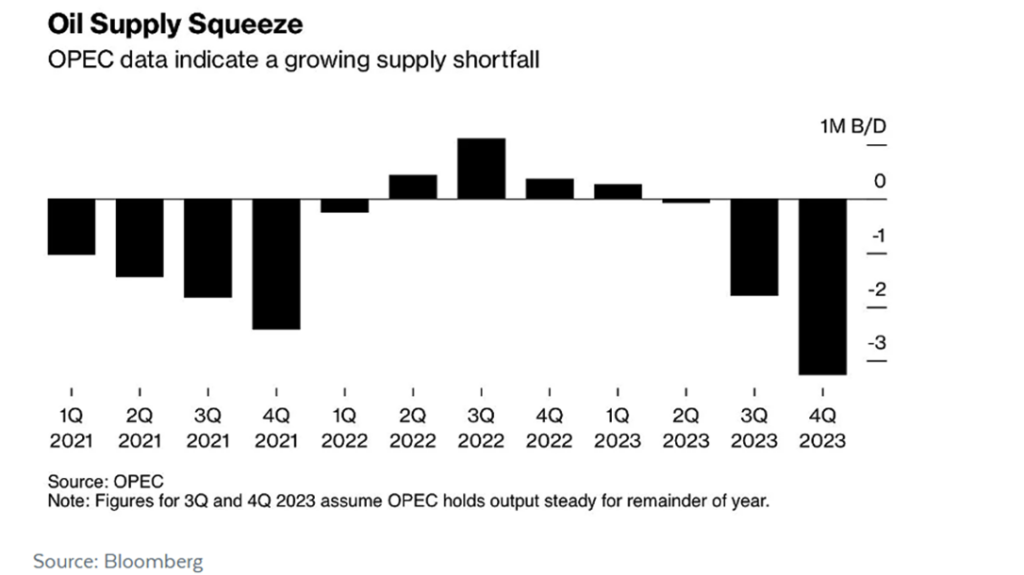
The US PPI on a month over month basis was higher than expected while the core inflation result was in line with estimates (the core result strips out food and energy). According to data supplied by Bloomberg, the global oil market will face a shortage of three million barrels a day next quarter which would be the biggest deficit in over a decade as Saudi Arabia continues to extend its production cuts. The US is in a weak position as its Strategic Petroleum Reserve is at a 40-year low.
Uranium has also increased significantly in price jumping above $60 per pound earlier this week, the first time since 2011. Uranium prices skyrocketed following the Russian invasion of Ukraine, but prices have continued to climb. Last week the World Nuclear Association raised its forecasts significantly for nuclear power’s contribution to electricity generation leading to an increase in uranium demand. The estimates are more than 140 reactors could operate longer than previously expected. The nuclear fuel supply chain has been impacted significantly following the war in Ukraine as Russia plays a big role in the conversion and enrichment of uranium.
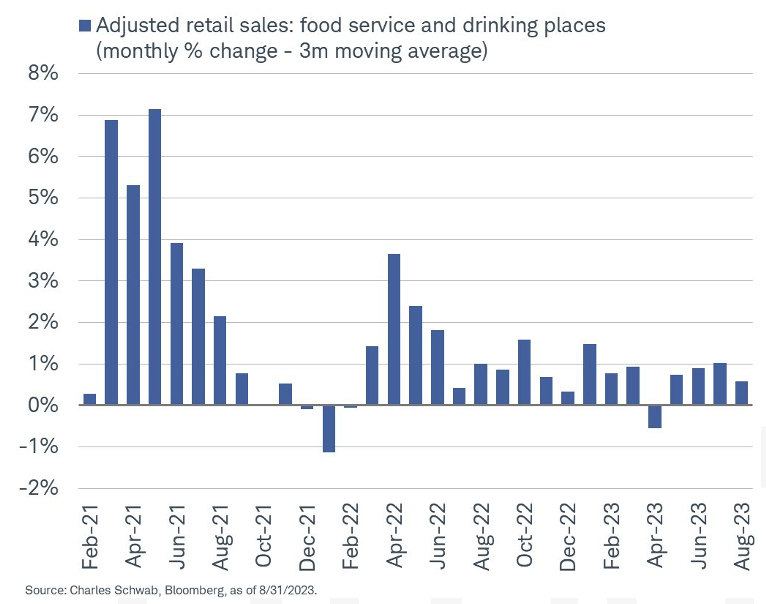
As we continue to watch the health of the consumer, restaurant and bar sales continue to move lower. While they typically adjust downward due to seasonality, the longer term trend is still moving down. The US now has a record $17.1T in household debt, a record $12T in mortgages, a record $1.6T in auto loans, a record $1.6T in student loans, and a record $1T in credit card debt. The average house payment is set to hit $3000 a month for the first time in history, and oil prices are up 40% in three months.
Equities
Despite the S&P 500 and Nasdaq trading back near their 50-day moving average they ultimately closed negative on the week. The Dow Jones Industrial Average gained 0.1% on the week, the S&P 500 fell (-0.2%), the Nasdaq fell
(-0.4%), and the Russell 2000 index dropped (-0.2%). Large cap tech stocks saw gains on Monday led by Tesla and Meta Platforms which were almost completely erased Tuesday as Oracle missed earnings putting a drag on stocks in the sector. Thursday saw August retail sales numbers come in better than expected and sent the DJIA to its best one-day point gain since early August. Stronger manufacturing data on Friday pushed yields higher and put more strain on major indices, sending them lower to close the week. Utilities, consumer discretionary, financials, and consumer services were the strongest sectors while technology and industrials were the weakest. US equity funds had inflows of $10.5 billion for the period ending 9/13/23 compared to outflows the prior week. Markets were not terribly volatile this week despite Apple’s iPhone 15 release and a higher-than-expected CPI print for August. Following the CPI news American Airlines cut its third quarter profit estimates due to increased fuel prices and new pilot contracts which drove the share prices down 5.7%. The ETF symbol JETS, which tracks the common stocks of US and international passenger airlines, opened roughly 2% lower Wednesday morning following the CPI print. Apple increased the price of their iPhone slightly which is a subtle move to increase revenue from consumers without triggering a huge concern. Google laid off hundreds of recruiters as hiring for the company continues to slow. This slowdown of hiring amongst the company began last year after large amounts of people were brought on in 2020 and 2021. The stock price jumped Wednesday.
Semiconductor stocks continue to struggle despite Arm’s successful IPO Thursday (Arm saw its stock price jump 25% after opening on its debut Thursday) and a Reuters report that Taiwan Semiconductor is delaying chip shipments.. Outside the US, markets were slightly stronger with developed markets outperforming emerging by a hair. While both positive, the MSCI EAFE was up 1.7% while the MSCI Emerging Market Index was up 1.2%. Globally markets were positive as seen by the MSCI World posting a 0.4% return for the week.
Fixed Income
Treasury yields rose slightly this week in anticipation of next weeks Fed meeting and the hotter than expected CPI data. The 2-year Treasury yield finished the week up 4 bps, while the 10-year Treasury yield climbed 7 bps, and the 30-year yield jumped 9 bps. Meanwhile, major bond index returns were mixed with the Bloomberg US Aggregate Bond Index falling -0.33%, the Bloomberg US Corporate High Yield Index rising +0.19%, and the Bloomberg US MBS Index falling -0.30%. Across the pond, the European Central Bank (ECB) raised interest rates by a quarter point for the 10th consecutive time, a likely divergence from an expected pause by the Federal Reserve next week. The ECB did hint that they may not need to hike rates further, stating that the decision is dependent on economic data.
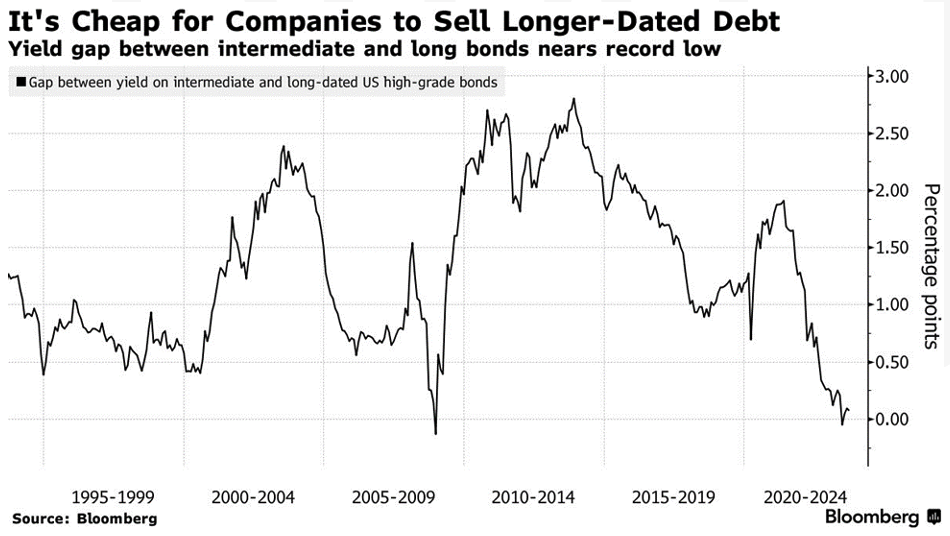
High-grade bond investors are beginning to ponder the move into longer term bonds, locking in interest rates in expectation that the Federal Reserve is nearing the end of this rate hike cycle. Due to a lack of long-duration offerings this year there is a scarcity premium on these bonds and some companies are taking advantage. Companies such as T-Mobile, Nevada Power Co., and Sierra Pacific Power are all putting up offerings in the 30-year range and seeing outsized demand from US investors. According to Travis King, head of US investment-grade corporate debts at Voya Investment Management, recently insurance and pension investors have been a key driver of the demand for long maturity bonds. We are still in the early stages of this move towards longer maturity bonds, with a majority of investors generally still betting on shorter term bonds. Last week we saw over $110B in bond sales globally, most of them coming due in under ten years, with most companies still not wanting to lock in high yields for longer periods if they can avoid it.
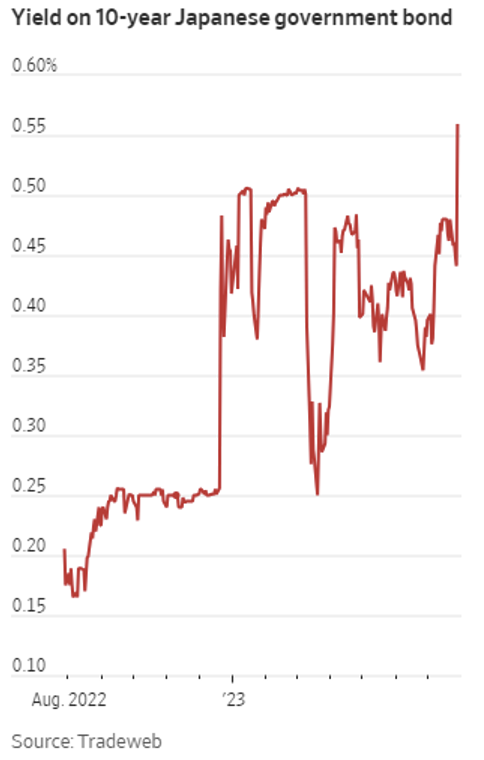
The Bank of Japan is making notable changes to its monetary policy, accepting higher yields on longer term government bonds, a possible sign of the end of negative interest rates in the region. The BOJ has been an outlier in monetary policy by not aggressively hiking rates during this cycle. Although Japanese bonds are much lower yielding than those in the US, Japanese investors could be influenced to buy domestic bonds in order to negate unfavorable currency moves. The main worry for this shift in policy is that it could cause Japanese investors to start selling their foreign investments which would cause a substantial increase in global yields and push down the US equity market.
HEDGE FUNDS (as of Thursday, September 14, 2023)
Global indices were in the green this week, though hedge fund (HF) performance globally was challenging which was reflected in the limited upside capture. The average global HF captured ~25% of the upside of the MSCI World (+30 bps vs. MSCI +1.2%), while equity long/short (L/S) funds similarly gained ~30 bps on the week. Americas-based L/S equity funds gained slightly more in absolute terms as they ended the week up ~40 bps (vs. S&P 500 +1.1%), capturing closer to 35% of the upside of the S&P. The performance drag was due in part to the top 50 crowded longs underperforming the S&P (+80 bps WTD) and the top 50 crowded shorts outperforming (+1.9%). Performance in other regions followed the same trend, with the average EU-based fund similarly capturing ~35% of the upside gaining +50 bps (vs. Euro STOXX 600 +1.4%). The average Asia-based HF gained only ~20 bps (vs. MSCI Asia +1.3%).
As global equities rallied higher this week, HFs were net buyers of equities across most regions. The buying was led by North America (NA) as HFs added to gross exposure in an ~60/40 split between longs and shorts. While HFs are positioned long defensives/short cyclicals, flows inflected as HFs were buyers of most cyclical sectors this week, led by financials (capital markets), followed by industrials, energy, materials, and consumer discretionary. Diving into consumer discretionary further, HFs were buyers of hotels, restaurants & leisure and autos but were net sellers of most other industries within the sector. HFs were also net buyers of defensive pockets of healthcare via HC equipment & supplies and pharma. Within the defensive group, there had been small spurts of buying across utilities at the end of last week and into this week, but HFs ultimately ended as net sellers of the group WTD, and positioning remains near multi-year lows. HFs added shorts in mega-cap TMT and AI beneficiaries as they continued to pare back outsized directional tilts to the group. Short exposure across mega-cap TMT names rose to near the 90th percentile on a 12M lookback vs. sitting below median levels a week prior. Macro products were net bought for the week driven by both long buys and short covers.
HFs were also net buyers of European equities in a similar 60/40 split with long adds outpacing shorts. The net buying, however, was more moderate in comparison to previous weeks of buying seen in the region. Industrials, energy and materials led the net buying as they accounted for the bulk of the long adds while tech and consumer-related names made up the bulk of what was added on the short side. In AxJ, flows were mixed at the country level as Australia, Singapore and Taiwan were net bought while China, India, and South Korea were net sold. At the sector level, tech, healthcare and consumer discretionary were net bought while industrials, financials and communications services net sold. Net flows to Japan were more muted as HFs covered shorts and trimmed longs in nearly equivalent amounts and net flows ultimately skewed towards net selling, driven by TMT-related names and industrials.
Private Equity
Private equity giants like Blackstone, Apollo, and KKR have seen their assets under management (AUM) grow this year, despite industry-wide fundraising challenges. This growth can be attributed to the increasing importance of perpetual capital, which are investment funds with indefinite lifespans and flexible exit timelines.
Data from PitchBook’s US Public PE and GP Deal Roundup reveals that by the end of Q2 2023, perpetual capital held by seven publicly-traded private equity giants had risen by 13.2% year-over-year, reaching approximately $1.2 trillion. This surge exceeded the growth rate of their total AUM, which rose by nearly 10%. Blue Owl experienced the fastest increase in perpetual capital, with a 24% rise over the 12 months ending in June.
Perpetual capital frees fund managers from the constraints associated with traditional private capital funds, such as capital calls, exit deadlines, and repeated fundraising efforts. To secure perpetual capital, PE firms have pursued insurance assets and a broader range of individual investors. This has led to the development of investment products tailored to retail and high net worth investors and numerous deals with insurers.
PE firms have also turned to insurance companies to bolster their sources of long-term funding. Notable examples include Apollo’s $43 billion merger with Athene Holding and Blackstone’s partnership with Resolution Life, which brought in $60 billion in new insurance assets. In Q2 2023, the seven publicly-traded PE managers reported a combined $674 billion in insurance-related capital, constituting 55.8% of their total perpetual capital.
There has been a resurgence of interest from GPs in attracting retail capital. Many large investment firms have introduced new investment products and hired talent to tap into the vast assets held by retail investors. Blue Owl’s success in raising $1.8 billion through retail perpetual vehicles in Q2, compared to $1.1 billion from institutional investors, highlights the potential of the retail channel. Additionally, some boutique, single-strategy managers have also diversified their offerings to target the retail market. They have sold minority interests to GP-stake investors to access the capital needed for expansion.
Perpetual capital vehicles provide more flexibility and less exit pressure compared to traditional funds. GPs in perpetual vehicles are not bound by preset exit timelines, allowing them to hold onto assets in a market with limited exit opportunities. Additionally, they can avoid the costs and efforts associated with frequent fundraising.
Finally, perpetual capital vehicles offer steady fees to alternative asset managers. For example, Blue Owl reported that 93% of its management fees in Q2 came from perpetual vehicles, while Blackstone generated 45% of its total fee-earning AUM from roughly $328 billion in perpetual capital during the same period. This steady fee income is an attractive feature of perpetual capital.
Authors:
Jon Chesshire, Managing Director, Head of Research
Elisa Mailman, Managing Director, Head of Alternatives
Katie Fox, Managing Director
Michael McNamara, Analyst
Sam Morris, Analyst
Data Source: Apollo, Barron’s, Bloomberg, BBC, Charles Schwab, CNBC, the Daily Shot HFR (returns have a two-day lag), Goldman Sachs, Jim Bianco Research, J.P. Morgan, Market Watch, Morningstar, Morgan Stanley. Pitchbook, Standard & Poor’s and the Wall Street Journal.