
Economic Data Watch and Market Outlook
Global asset prices were mostly in the negative for the week ending on September 8th. The MSCI World benchmark fell 1.33% while the S&P 500 fell 1.26%. The Bloomberg US Aggregate Bond index also fell 30 basis points. Good news is bad news as the US economy continues to maintain its strength as factory orders and jobless claims came in better than expected which likely means that rates will stay higher for longer. This should not come as a surprise as Fed officials continue to telegraph that they are not cutting rates anytime soon.
August factory orders declined 2.1% with the consensus expecting a decline of 2.5%. Auto and truck sales came in slightly lower than expected with autos at $3.05 million versus $3.14 million and trucks at $11.99 million versus $12.60 million. When autos are removed from the factory orders result, they increased more than expected, 0.8% versus 0.3% for the month.
Jobless claims were also lower than expected with 216,000 claims, the lowest since February (the expectation was 234,000).
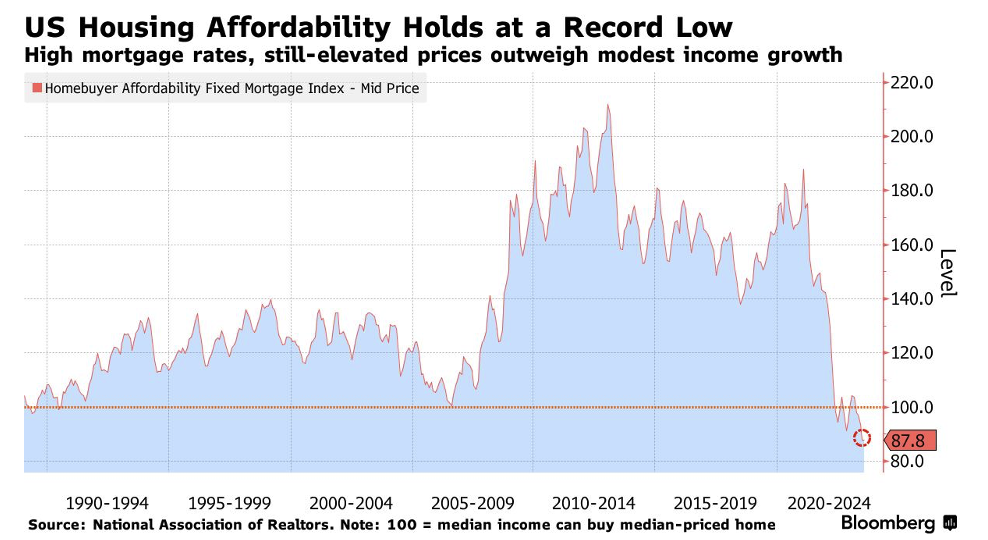
Housing continues to be an issue. Results reported this week showed that US housing affordability remained near record lows in July. The National Association of Realtors Housing Affordability Index came in at 87.8 in July, the lowest level since 1989. Typically, families are spending 28.5% of their income on principal and interest payments on a mortgage – an all-time high. Qualifying income for a mortgage based on a 20% down payment came in at $104,496 in July. Lack of inventory has continued to put upward pressure on prices and allowed the housing market to nearly recover from nearly $3T in loss of value last year.
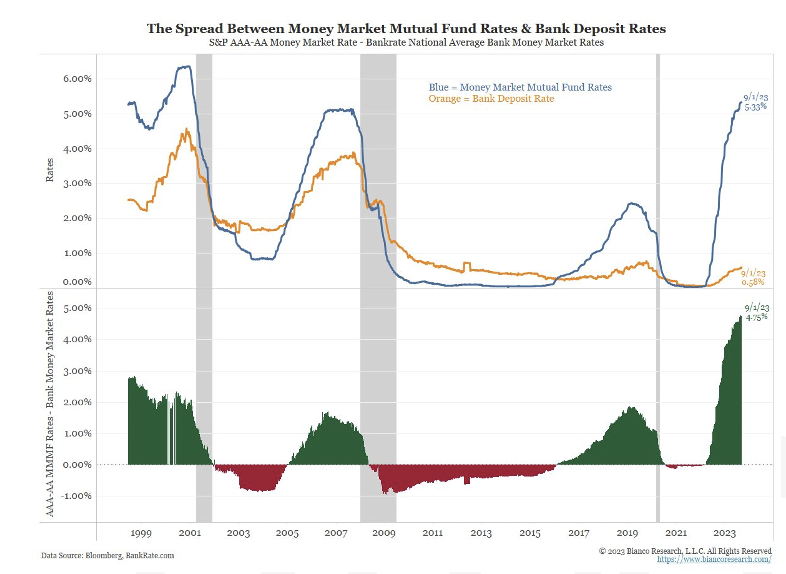
The banking crisis earlier this year, as well as the deposit outflows due to the continued mis-match between money market and deposit rates, have curtailed lending by banks.
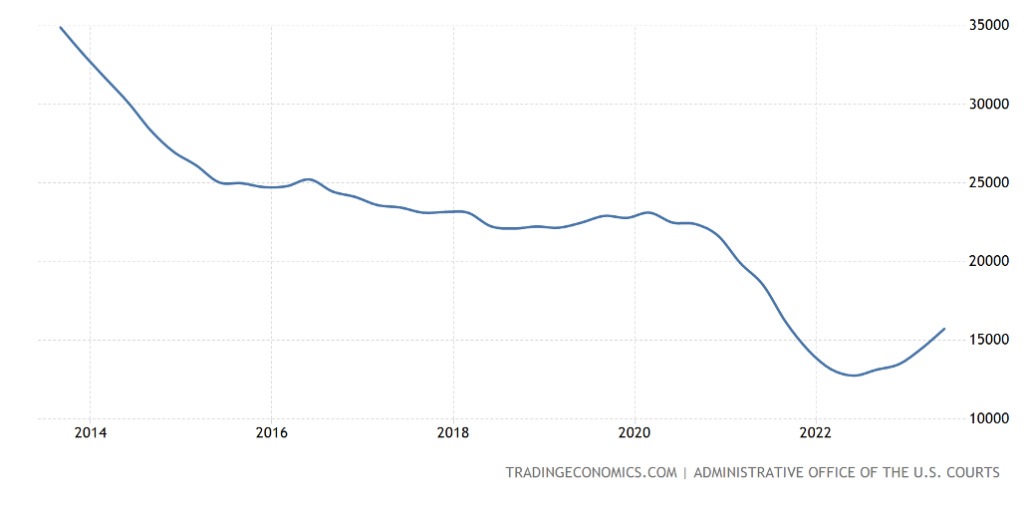
The recent Senior Loan Officer Opinion Survey on Bank Lending Practices (SLOOS) released by the Federal Reserve shows respondents indicating that they are tightening credit in most forms. Those tighter standards have seen bankruptcy rates increase. A headline from Bloomberg News, Business Bankruptcies Soar in August as Rising Interest Rates Bite, noted that bankruptcies ending in August are up 54% on a year over year basis. The objective of the Fed is to slow the economy down so bankruptcy will occur such as Yellow Trucking noted in past weekly write-ups. However, while the trend is rising and the headline appears grim, we are far below the previous years’ results. Charge-offs and delinquencies reported to and by the Fed are also very low relative to historical norms.
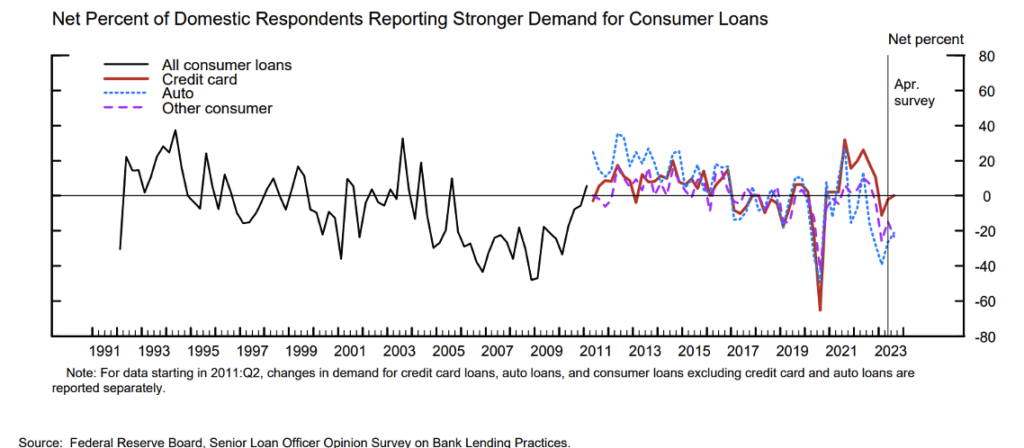
From the same SLOOS survey, there appears to be an early sign that consumers are requesting more credit, specifically installment loans. We’ve noted this in the past related to the use of revolving credit such as credit cards. The upward trend is far more significant than that of commercial requests/interest.
In the upcoming week, we will watch the G20 meeting closely and how the results impact the relationship between the US, China, and India. On the economic front, the highlight will occur later in the week as data related to Producer Prices and Consumer Prices are released.
Equities
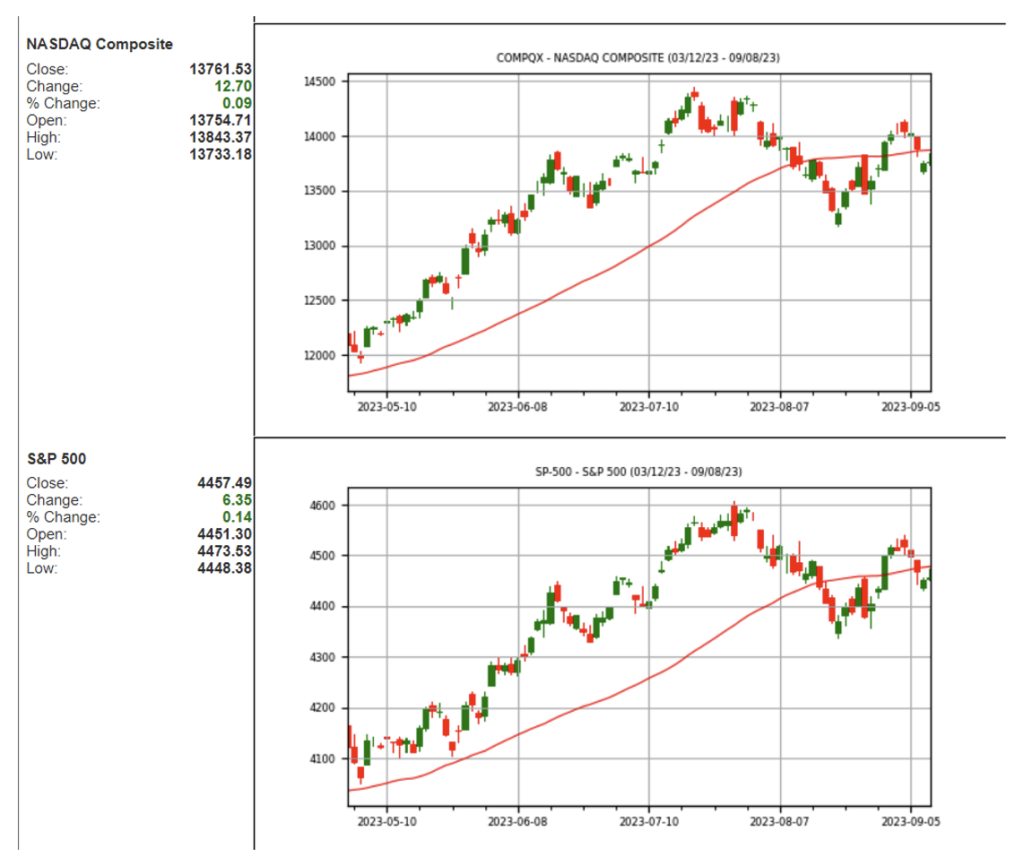
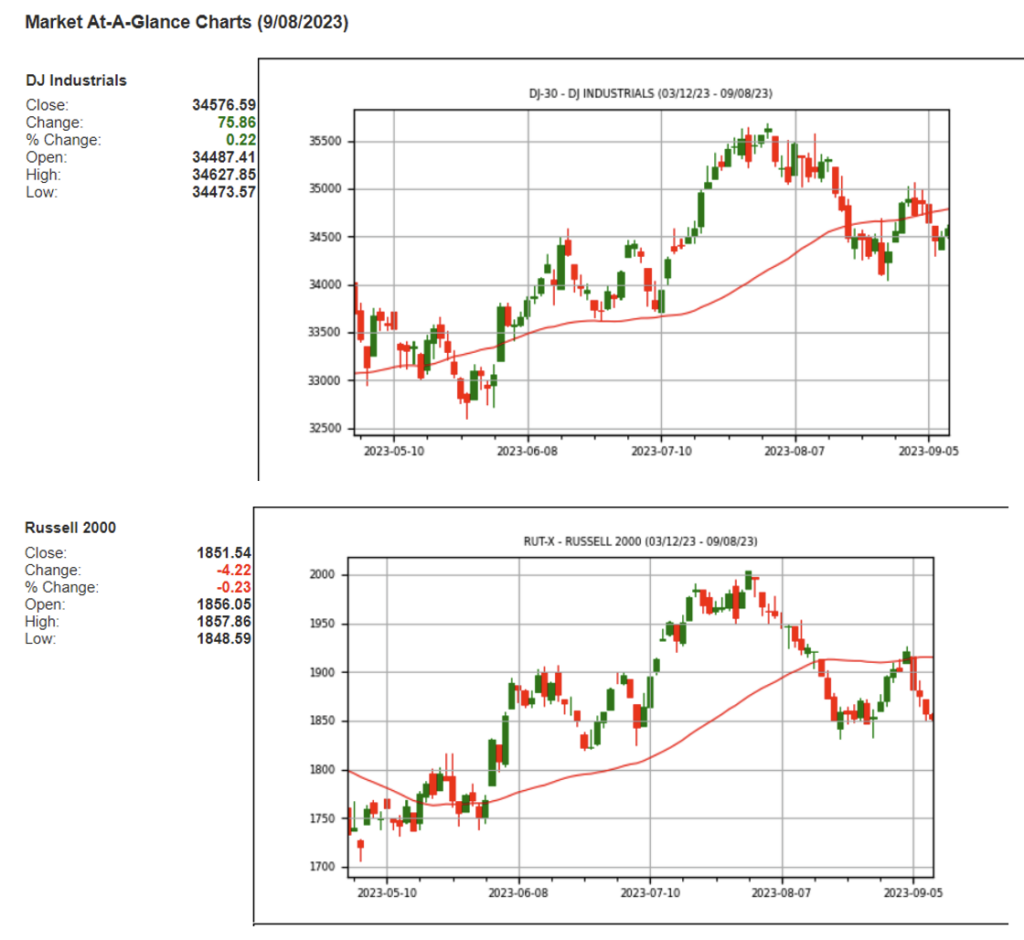
This week the Dow Jones Industrial Average lost (-.07%), the S&P 500 lost (-1.3%) and the Nasdaq dropped (-1.9%). Small caps were the laggard over large caps as the Russell 2000 fell (-3.8%). This week snapped a two-week win streak for both the Nasdaq and the S&P 500.
The S&P 500 declined this week due to concerns around the potential path of interest rates and a sell off of Apple shares. The tech heavy Nasdaq sold off as well and marked its 5th straight day of losses to close the week. The latest jobless claims report suggests that the labor market remains tight signaling that the Fed may need to raise rates leading to the sell-off recently.
Apple stock hurt major indices this week following the news that Chinese government is banning the iPhone and other foreign devices from use by government workers. The ban may also extend to state-owned enterprises and other government backed agencies. This will take a notable chunk out of potential buyers in China as Apple currently ships roughly 230 million iPhones globally and this would eliminate roughly 56 million potential buyers that are employed by the Chinese government. Chinese tech company Huawei Technologies has launched a new smart phone delivering 5G-like speed. Following the news Apple stock fell 7% over the next few days. Being that China is still the largest manufacturing base by far it makes Apple as an easy target for economic tension between the US and China. China has also deployed other types of restrictions for US firms such as withholding approval on major mergers and acquisitions which halted growth plans for semiconductor companies Qualcomm, Intel, and Applied Materials, plus others. Apple is also one of the world’s biggest buyers of chips and stock prices for semiconductor companies fell following the announcement as the PHLX semiconductor index fell roughly (-2%) Thursday. The sell-off was seen across many other large cap stocks. Information technology was the worst performing segment of the S&P 500 following the Apple news dropping (-1.6%) as companies such as Nvidia declined (-1.7%) and Microsoft fell (-0.9%) too.
Novo Nordisk, the Danish company responsible for weight-loss drugs Ozempic and Wegovy, has surpassed Louis Vuitton as the largest European company by market cap. JP Morgan data suggests that their market cap will only increase as the obesity market estimate is estimated to hit $71 billion in sales by 2032.
A spike in crude oil prices added to inflation concerns as OPEC+ extended their production cuts to year-end boosting yields higher and equities lower. The rise in rates impacted homebuilders as the iShares US Home Construction ETF fell (-4.66%) before recovering those losses to close the week. Energy and utilities were the winners amongst the sectors while industrials, materials, technology, healthcare, and financials all saw losses. US equity funds, including ETF’s, saw outflows of $5.2 billion for the period ending 9/6/23 compared to outflows of $217 million the previous week.
Sources: Schwab /WSJ
Fixed Income
Treasury yields rose to start September after rising throughout August. The 2-year Treasury yield jumped 11 bps, the 10-year Treasury yield climbed 8 bps, and the 30-year Treasury yield rose 4 bps. Meanwhile, bond indices fell this week with the Bloomberg US Aggregate Bond Index falling -0.30%, the Bloomberg US Corporate High Yield Index falling 0.31%, and the Bloomberg US MBS Index falling 0.33%.
Mortgage rates have started to see a pullback in recent weeks, yet mortgage demand continues to fall. Total mortgage application volume fell by 2.9% last week according to Mortgage Bankers Associations seasonally adjusted index. Mortgage applications have declined to their lowest level since December 1996 and re-financing applications have also dropped off, falling by 5% last week, now 30% lower than a year ago. Currently a 30-year fixed rate mortgage is sitting at 7.12%, down from a peak of 7.23% on August 24th, according to Freddie Mac. With most homeowners currently holding home loans with rates under 4%, there is an incentive to stay put and hold on to lower monthly mortgage payments, causing demand to fall.
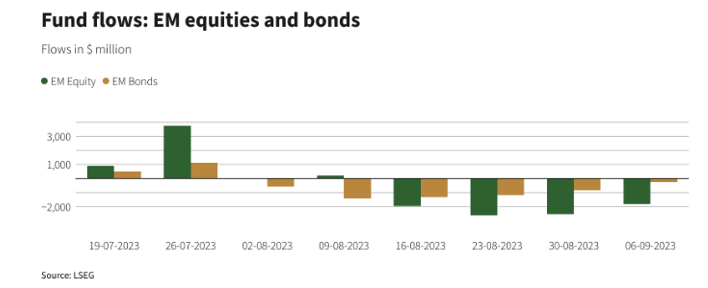
Global money market funds saw strong inflows this week as investors continue to move towards a more risk off approach. Globally we saw $57.38B flow into money market funds this week, the largest weekly net purchase amount since June 7th. We are also seeing a resurgence towards global bonds after a relatively slow August. During August, most of the outflows we saw came from emerging market bonds which were hit with outflows of $271M to start September. Despite outflows in August, the outlook for emerging market debt is starting to look more favorable after a poor 2022, where emerging markets faced geopolitical issues, uncertainties in China, and of course the war in Ukraine. Excluding China, many emerging market regions such as India and Latin America have a positive outlook going forward as inflation has been relatively contained, and modest growth is projected for the next several years.
Hedge Funds – as of September 7, 2023
Similar to what occurred in August, the average global fund was able to limit its losses to a fraction of what global benchmarks were down this week, with the average global fund down 20 bps through Thursday vs. the MSCI World down 1.2%.
Equity long/short (L/S) funds were down slightly more, with the group of Americas-based funds down 50 bps vs. S&P down 1.2%. This this represents ~42% of the downside, but an improvement from August’s performance (Americas-based L/S funds experienced ~90% of the S&P’s losses last month).The top 50 crowded longs in North America (NA) had underperformed the S&P throughout August, but they recovered some of the negative alpha this week as they were down less than the S&P (longs down only 90 bps). Crowded shorts lagged the S&P by 70 bps, resulting in a positive L/S spread of +1.2%. Performance this past week was mixed across funds in other regions. EU-based funds’ returns held in well as they only gave back 20 bps (vs. Euro STOXX 600 -1.0%), whereas Asia-based hedge funds (HFs) slightly lagged the MSCI Asia Pacific (the average fund was down 30 bps vs. index -10 bps). With equities selling off this week, HFs tilted towards selling global equities, resulting in net leverage tracking lower. Across US-based L/S equity funds, net leverage fell 4% WoW to 45% (41st percentile over last 5 years). Even though the net selling was a result of short adds (long flow was flat), gross leverage was flat at 189% due to mark-to-market impacts.
The net selling this past week was largely concentrated in NA (the largest in nearly six months), though this came amidst relatively light volumes due to the time of year. In NA, the net selling was split evenly between index-level products and single-name equities. The selling at the single-name level was largely concentrated in consumer discretionary and TMT-related industries. Within consumer discretionary, autos and specialty retail drove the activity. As for TMT, the selling was most visible in semiconductors, tech hardware, and entertainment with the selling a product of short adds as opposed to long selling. Real estate and materials also contributed to the net selling in smaller amounts. Lastly in NA, HFs were net buyers of traditional defensive industries including healthcare and consumer staples. The buying within each sector was spread across most related industries.
Looking at other regions, the net flows were more muted. In Europe, long and short additions paired off (i.e., the net flow was flat). At the sector level, shorts were added in consumer discretionary, industrials, and tech whereas financials, materials, and consumer staples were most of the long additions. In Asia, HFs tilted towards selling Asia ex-Japan and Japan, albeit in a relatively small amount, with the selling of each region a product of short adds outpacing long buys. Chinese stocks were net sold for the 6th straight week.
Private Equity
The valuation dynamics in the venture capital landscape have been shifting, particularly affecting seed-stage startups. In 2022, as valuations of VC-backed companies were undergoing a downward correction, seed-stage companies initially appeared resilient. However, the latest data from PitchBook’s Q2 2023 US VC Valuations Report reveals a 17% decline in the median pre-money valuation of seed-stage deals.
This drop in seed-stage pricing is attributed to the challenges startups are facing when trying to secure Series A funding rounds at substantial markups. In Q2, the median valuation step-up in early-stage rounds reached its lowest point since Q3 2013, with a value of just 1.6x.
While seed-stage valuations were on the rise, the median prices of early-stage startups experienced a substantial 37% decrease between Q1 2022 and Q1 2023. This diminishing valuation delta between seed and Series A rounds has raised the bar for Series A investments.
Series A investors are now demanding more significant annual recurring revenue and a clear path to positive unit economics from startups, a shift from previous years. This changing landscape has led many seed-stage startups to seek extension rounds from existing investors, with estimates suggesting that approximately 80% of seed-stage companies require such rounds before pursuing Series A funding.
The combined effect of these factors is exerting downward pressure on seed-stage valuations, and analysts suspect this trend may continue and that multistage firms, which had been increasingly involved in seed investing, may become less active as they allocate more resources to larger, financially challenged companies in their portfolios.
Analysts suspect that the seed market may undergo further corrections as the dynamics of the venture capital landscape continue to evolve.
Authors:
Jon Chesshire, Managing Director, Head of Research
Elisa Mailman, Managing Director, Head of Alternatives
Katie Fox, Managing Director
Michael McNamara, Analyst
Sam Morris, Analyst
Data Source: Apollo, Barron’s, Bloomberg, BBC, Charles Schwab, CNBC, the Daily Shot HFR (returns have a two-day lag), Goldman Sachs, Jim Bianco Research, J.P. Morgan, Market Watch, Morningstar, Morgan Stanley. Pitchbook, Standard & Poor’s and the Wall Street Journal.
![]()