
Economic Data Watch and Market Outlook
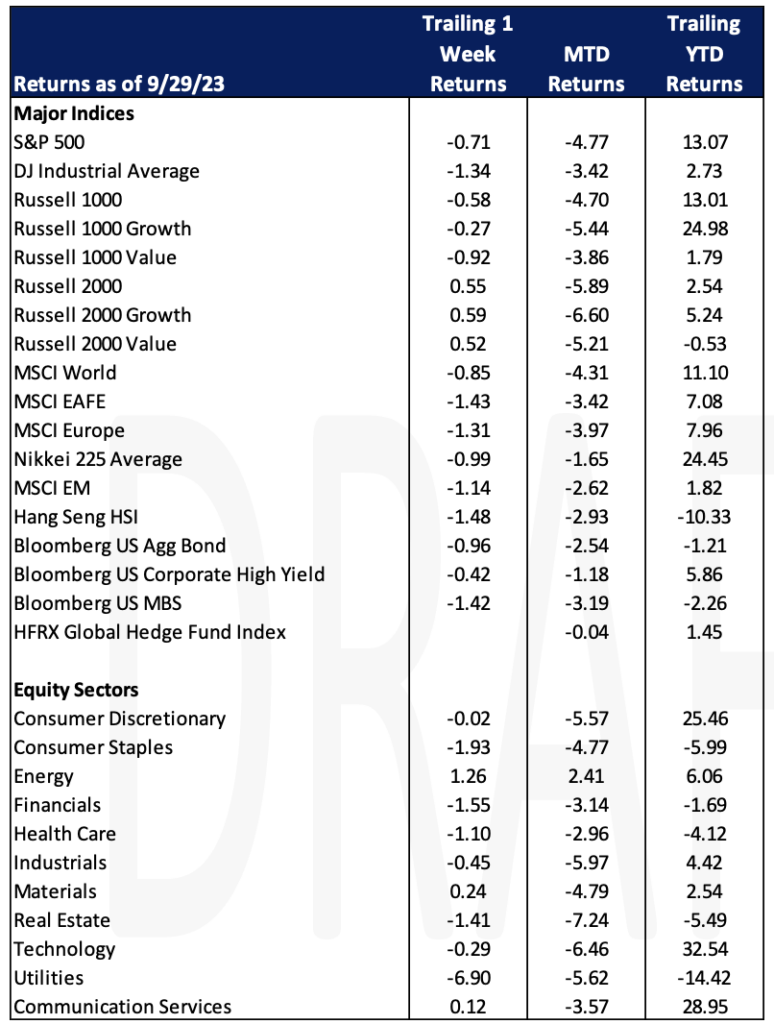
The S&P 500 dropped 71 basis points this week, the Dow Jones Industrial Average fell 1.34% and stocks outside the United State fell roughly the same amount as the Dow (MSCI EAFE -1.43%).
The Housing Price Index, which measures the price movement of single-family homes with Fannie Mae or Freddie Mac, rose more than expected on a month over month basis, 0.8% versus 0.5%. The Case- Shiller House Price Index that is more common in the media examines price changes in 20 metropolitan areas. That result also exceeded forecasts rising 0.1% versus a forecast of -0.3%. New home sales declined 8.7% on a month-over-month basis and pending home sales declined 7.1% versus a forecast of -0.8%. There is some cyclicity in late summer months as home purchases are often secured before the school year starts but higher rates, the average of which is 7.41%, and lack of supply continue to be significant headwinds.
While a US Government Shutdown was averted at the 11th hour on Saturday 9/30, the resumption of student loan payments is set to resume on October 1st. Payments had been deferred as a result of COVID and could place significant pressure on consumers during the holiday season.
Durable goods orders exceeded expectations continuing to make a case for the Fed to leave rates higher for longer. Orders were up 0.2% versus the forecast of a decline of 0.5%. The Core result saw an increase of 0.4% versus a forecast of 0.1%.
The UAW strike is continuing to grow, now with 25,000 workers on strike across 43 facilities in 21 states. The strike began two weeks ago at a GM plant and has since spread to Stellantis and Ford plants as well. Last week the strike reached 38 parts distribution centers across the country, affecting more than 5,600 workers. The impact on vehicle supply and production is still being calculated, but it should be noted that due to pandemic auto production deficits, there is a current lack of light vehicles on the market compared to pre pandemic times. According to S&P Global, in 2021 more than 9.5M light auto units were lost due to supply chain issues.
Jobless claims were less than expected with Continuing claims slightly less than forecast (1,670K versus 1,675K) and Initial Claims came in at 204,000 versus a forecast of 215,000.
While the government shutdown averted temporarily, this week we’ll see data releases related to manufacturing as well as the Purchasing Managers Index (PMI) data. As rising oil prices are a continuing concern, data will be released mid-week regarding oil inventories and as winter approaches, heating oil stockpiles.
Equities
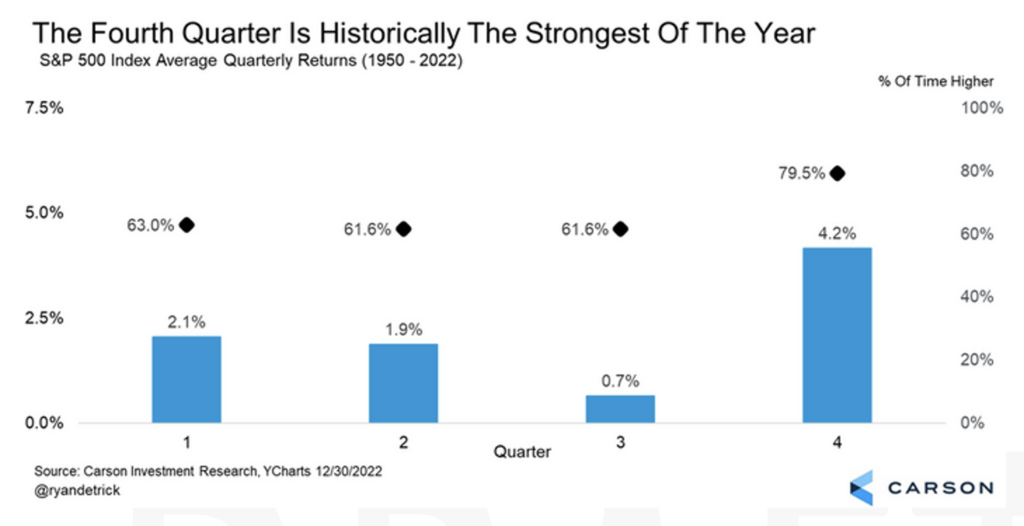
According to data compiled by Marketwatch, the fourth quarter has historically been the strongest quarter for the US stock market, with the S&P 500 up 79.5% going back to 1950. Conversely, the S&P just recorded its worst month since December 2022 falling 4.77% and had its worst performing quarter for the year. Key drivers of performance year-to-date have been seven stock across, technology, consumer discretionary, and communications services but those sectors were been key detractors this past month. Only one sector, energy, increased in September, up 2.41%.
Large cap growth and large value stocks fell for the week (Russell 1000 Growth -0.27%, Russell 1000 Value -0.92%) with only three sectors having a positive return, energy, up 1.26%, materials, up 0.24%, and communication services up 0.12%.
Small cap stocks advanced for the week as the Russell 2000 rose 0.55%.
The MSCI EAFE benchmark, a measure of international equity performance, fell 1.43% while emerging markets were down just 1.14% as per the MSCI EM Index. This week Chinese property stocks fell to their lowest level since 2011 as worries about their liquidity and weak housing demand grows. A recent survey from Cheung Kong Investor Sentiment Survey showed Chinese investors plan to cut their allocation to property over the next year.
Fixed Income
Treasury yields saw mixed returns this week with most investors focused on the dramatic rise in the 10-year Treasury yield which hit 4.67% on Thursday, the highest level since 2007. Meanwhile the 2-year Treasury yield fell 7 bps to 5.03%, and the 30-year Treasury climbed 2 bps to 4.73%. Major bond indices saw losses in light of rising rates, with the Bloomberg US Aggregate Bond Index falling -0.96%, the Bloomberg US Corporate High Yield Index falling -0.42%, and the Bloomberg US MBS Index falling -1.42%. Furthermore, money market funds are continuing to see attractive yields above 5%. Mortgage rates are also reaching nearly 8%, according the Bankrate.com, the national average 30-year fixed rate mortgage currently sits at 7.83% as of Friday, September 29th.
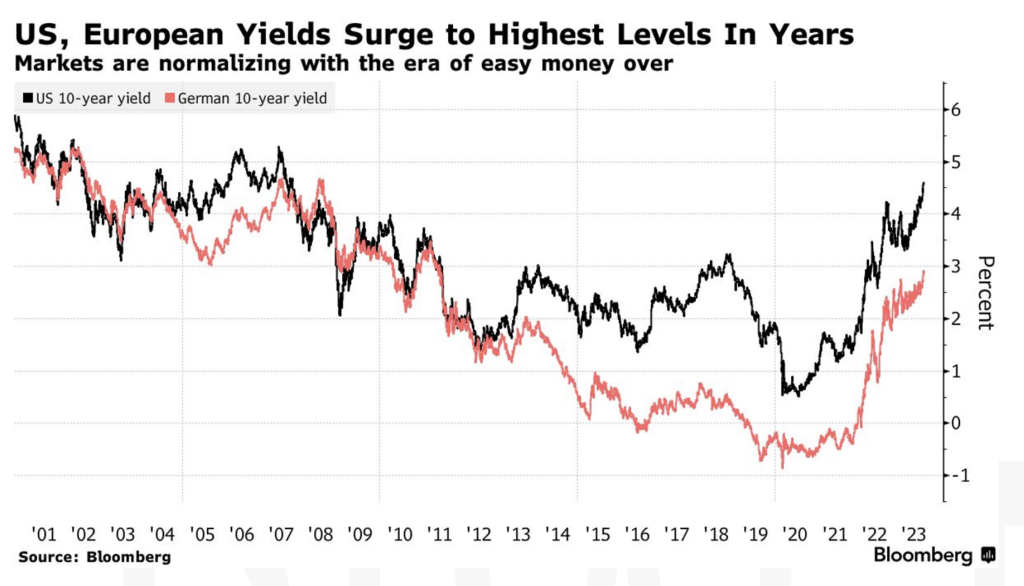
This week proved to investors that higher rates are here to stay, solidifying the message that the Fed has been reiterating at their last few monthly meetings. Both US and European yields are reaching their highest levels since the Global Financial Crisis, and showing no signs of stopping, signaling to investors that the cycle of historically low interest rates over the last 10 years is ending. Germany’s 10-year yield just saw its largest jump this year, and the US 3-year yield has posted its largest quarterly jump since 2009. Yields reaching these levels are putting pressure on next CPI reading on October 12th which will be an important factor in where yields move from here.
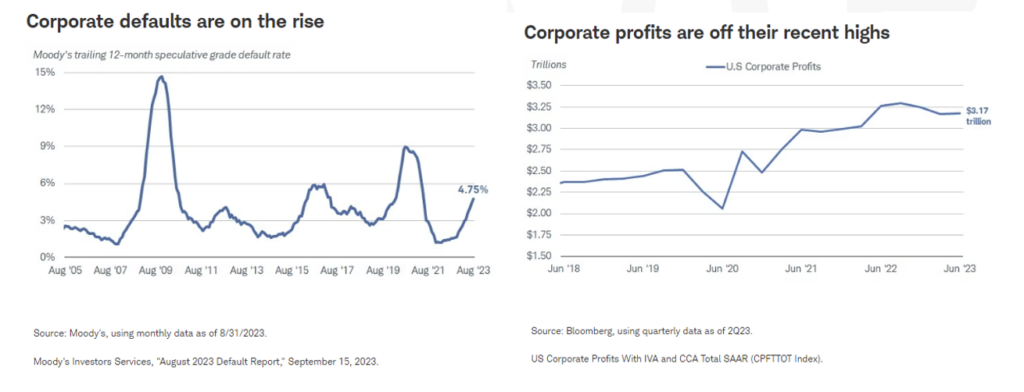
Corporate defaults and bankruptcies are trending upwards as of the end of August according to a report by Moody’s Investors Services, published on the 15th of September. Primary drivers of this rise in default rates are declining corporate profits and rising borrowing costs. Although the rise in interest rates has been a positive for investors, it has hurt borrowers. According to the Bureau of Economic Analysis, corporate profits before taxes peaked in the third quarter of 2022 at $3.3T and have seen a modest decline since. Though the decline has been modest, markets expect the environment to remain challenged due to high labor and borrowing costs as well as slowing demand.
Hedge Funds
For the week ending Thursday, September 28th, the average global hedge fund (HF) posted losses of ~20 bps vs. the MSCI World down nearly 1%. Americas-based long (L/S) equity performance held in fairly well declining 10 bps vs. S&P 500 -50 bps. This was achieved despite the most crowded shorts in the region rallying +1.2% while the most crowded longs ended flat this past week potentially mitigating some of the negative short alpha. Across other regions, EU-based funds were able to limit its losses to ~30% of the Euro STOXX 600’s loss. Asia-based managers were able to stay flat on the week amidst the MSCI Asia Pacific declining -1.8% through Thursday. The crowded stocks in Asia can help explain the stronger performance, with longs outperforming the index by 90 bps and shorts lagging by 30 bps (resulting in a positive spread of +1.2%).
Flows were quiet for the week as HFs trended towards adding long and short exposure in a relatively small but equal amount. The gross additions were largest in Europe, with the short adds surpassing the long buys (i.e., HFs were net sellers of Europe). Most sectors within Europe saw longs and shorts added in relatively similar amounts, resulting in the net flow to most sectors looking relatively flat. Industrials (aerospace & defense, machinery) and consumer staples (beverages) were the only exceptions where there was some directionality to the flow, with the former tilting net sold and the latter ending net bought. As for other regions outside of the US, both Asia ex-Japan and Japan were net sold. The selling of AxJ was due to both long selling and short additions and was mostly concentrated in China (A-Shares, ADRs). As for Japan, HFs selling industrial longs drove the bulk of the region’s selling. Regarding the flow in North America (NA), long adds outpaced short adds leading to the region ending net bought. To note, multi-strategy/macro and quantitative funds accounted for the bulk of the gross additions on both sides of the book this past week, whereas there was more limited activity from equity L/S funds. By sector, those areas of the market where HF ownership was lightest entering the week ultimately ended as the most net bought (albeit in a relatively small amount). This included industrials (industrial conglomerates), energy (E&Ps), and financials (banks, capital markets), with long additions driving the buying of each. HFs flipped to small buyers of tech after having sold the sector for the past month. A majority of the tech net buying this past week took place on Wednesday and Thursday as HFs covered shorts in semis and tech hardware and added longs in software.
Private Equity
European venture capital has seen a significant uptick in deals involving secondhand stakes in startups due to diminishing liquidity options for investors and employees of portfolio companies. In contrast to their counterparts in the US, European VCs were initially hesitant to adopt direct secondaries, where founders, employees, and investors sell shares. This hesitancy was partly due to a smaller primary market and more complex deal terms, but the tide has turned in the last year.
Shareholders in European startups are increasingly open to secondaries deals, as the challenging environment for exits becomes a critical factor. The first half of 2023 witnessed a drop in exits in Europe, with only 443 compared to 612 during the same period in the previous year, as reported by PitchBook’s Q2 2023 European Venture Report.
Venture capitalists are feeling the pressure to distribute capital to their Limited Partners (LPs), particularly early-stage investors whose capital has been tied up in portfolio companies for extended periods. VC secondaries are gaining momentum, enabling them to satisfy LPs and free up capital for other investments. Founders and employees are also becoming more active in selling their stakes, as their wealth is often significantly tied to startup equity. The availability of secondary deals can enhance employee motivation and retention by providing tangible benefits from their work and reducing financial stress.
Despite the growing interest in European VC direct secondaries, pricing remains a challenge for investors. These rounds are usually conducted at a discount to the last valuation, as buyers seek compensation for providing early liquidity. However, some investors and companies are reluctant to lower their valuations, fearing that a secondary transaction with a lower valuation will set a benchmark for future funding rounds.
Activity levels in the direct secondaries market vary between high-performing companies, which can command a premium, and less attractive assets with slower growth. It is expected that companies that raised capital during the peak of the VC bubble may experience down rounds, leading to increased activity in the next year.
A robust and well-functioning secondaries market is viewed as essential, particularly in an asset class characterized by lengthy paths from seed to IPO. This shift in attitude towards secondaries is considered beneficial for the industry.
Authors:
Jon Chesshire, Managing Director, Head of Research
Elisa Mailman, Managing Director, Head of Alternatives
Katie Fox, Managing Director
Michael McNamara, Analyst
Sam Morris, Analyst
Data Source: Apollo, Barron’s, Bloomberg, BBC, Charles Schwab, CNBC, the Daily Shot HFR (returns have a two-day lag), Goldman Sachs, Jim Bianco Research, J.P. Morgan, Market Watch, Morningstar, Morgan Stanley. Pitchbook, Standard & Poor’s and the Wall Street Journal.