
Looking Ahead This Week: October 12, 2026
The week ahead is among the most consequential of the fourth quarter for the Federal Reserve’s remaining 2026 decisions. September CPI, due Tuesday October 14, arrives as the most closely watched inflation print since the summer, carrying the combined weight of the Hormuz-driven energy cost surge, the September jobs miss that reshuffled rate-hike probability, and a Fed that hiked unanimously three weeks ago with 16 of 18 officials signaling more to come. The Cleveland Fed’s October 7 nowcast projects headline CPI at 3.60% year-over-year — up from August’s 3.4% — and core CPI at 2.39%. If the headline lands at or above 3.6%, it reinforces the case for the additional year-end hike that the dot plot implied and that last week’s FOMC minutes confirmed is the majority view; if it surprises to the downside despite energy pressure, the October 27-28 meeting may mark the end of the tightening cycle. Either way, Tuesday’s print is the key variable separating a two-hike 2026 from a one-and-done scenario — a distinction that now commands the attention of virtually every rate-sensitive asset class.
Q3 earnings season begins in earnest Monday and Tuesday with the major banks: JPMorgan Chase and Wells Fargo both report before the open on Tuesday October 13, followed by Citigroup and other large-cap financials through the week. The consensus for Q3 S&P 500 earnings growth stands at approximately 30.6% year-over-year per LSEG — a figure that, if confirmed, would represent one of the strongest quarterly earnings performances of the post-pandemic era and provide a powerful fundamental counterweight to the policy uncertainty that has dominated the tape. For banks specifically, the September rate hike raises net interest income expectations, though the credit quality and loan demand implications of a labor market printing sub-30,000 jobs will be scrutinized closely. The October 27-28 FOMC meeting then closes the month: with futures markets pricing only a 16-25% probability of an October hike, the bar for a surprise tightening is high but not zero — and a hotter-than-expected CPI print Tuesday could move those odds meaningfully before the meeting.
Economic Data and Market Highlights: Week of October 5, 2026
Macro Backdrop
The week of October 5 delivered two events that together reset the market’s near-term policy and geopolitical expectations in opposing directions. The first arrived Wednesday when the Federal Reserve released the minutes from its September 15-16 meeting: a detailed record of a committee that voted 12-0 to hike but is internally divided about the pace and destination of further tightening. The minutes confirmed that most participants assessed another rate increase would likely be appropriate by year-end, with several officials describing the current policy rate as only mildly restrictive and expressing concern that sector-specific price pressures from energy disruptions and AI-driven demand could broaden into more entrenched inflation. The market’s immediate interpretation was nuanced: the minutes were unambiguously hawkish in their characterization of the inflation outlook, but the absence of urgency in the language — New York Fed President Williams was reported in commentary to have said there was ‘no need for urgency’ after September — and the weak September payroll data released the prior Friday shifted the probability distribution firmly toward an October pause. Futures markets priced only a 16-23% chance of a hike at the October 27-28 meeting, with December now the base-case scenario for the next move.
The second event was Iran’s reversal on the Strait of Hormuz. Barely two weeks after signaling at the United Nations General Assembly that it was considering a phased reopening of the waterway, Iran declared through official channels that the Strait ‘will not return to normal,’ citing what it described as U.S. breaches of trust in the diplomatic track. The reversal was swift and unambiguous: Tehran halted direct negotiations, Iranian President Pezeshkian stated that Iran would not enter forced negotiations and demanded the lifting of U.S. naval blockades on Iranian ports as a precondition for any further discussions, and Brent crude rose approximately 2% on the news to above $107 per barrel. The geopolitical whipsaw — diplomatic optimism collapsing into re-escalation within a single week — confirmed what the more skeptical market analysts had argued throughout the Hormuz negotiation: that the physical distance between an Iranian diplomatic signal and a functioning strait remains measured in months of verification and implementation, not the days the initial reports had implied. Energy sector investors responded accordingly, pushing the sector to +3.62% for the week and its highest year-to-date return of 2026 at +48.45%.
Domestic Equities
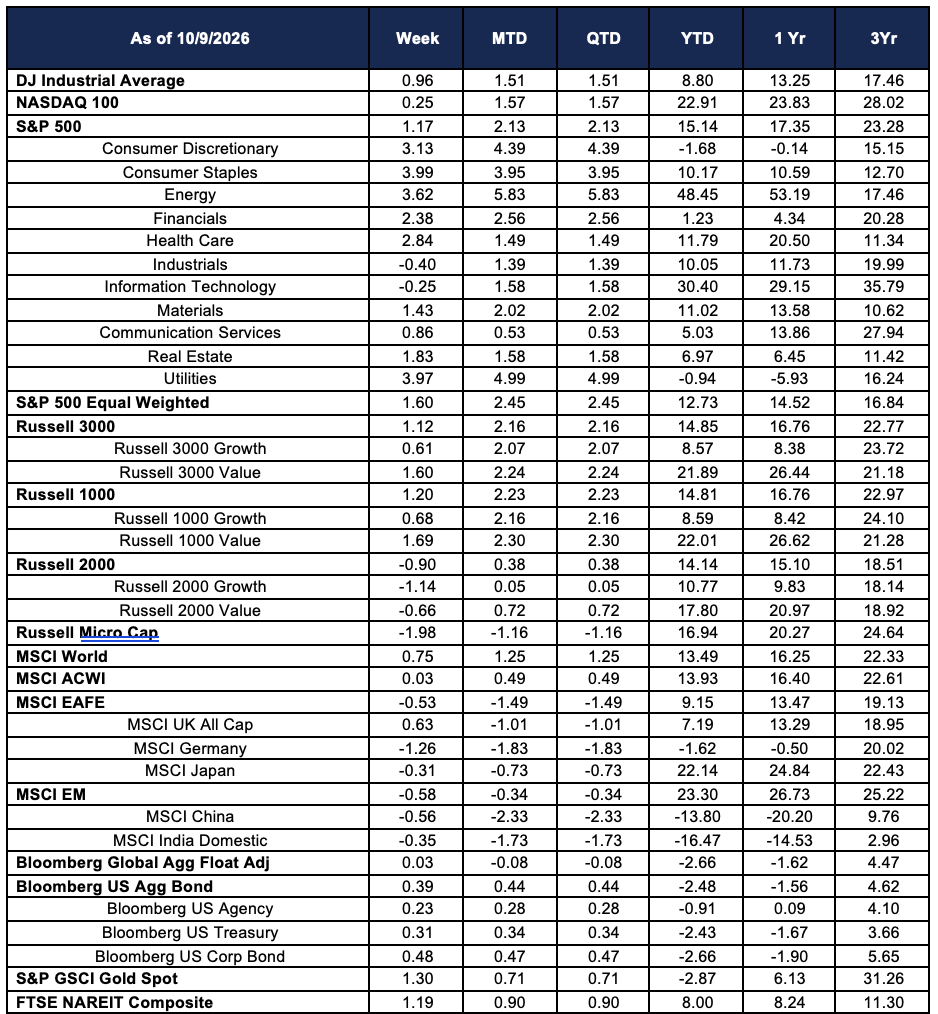
The S&P 500 gained +1.17% for the week, but the composition of the advance was perhaps the most unusual of 2026: a simultaneous surge in defensive sectors, Energy, and large-cap value, while Information Technology and small-cap growth declined. Consumer Staples led with +3.99%, Utilities advanced +3.97% — its best weekly performance of the year by a substantial margin — Health Care gained +2.84%, and Energy added +3.62%. The Dow Jones Industrial Average gained +0.96%, while the NASDAQ 100 added only +0.25% — a spread of 71 basis points that understates the extent of the rotation beneath the surface, as the NASDAQ’s positive result was driven primarily by non-technology components. The week’s Utilities performance merits particular attention: the sector, which had entered the week at -4.72% year-to-date after months of relentless rate-driven deterioration, recovered to -0.94% YTD in a single session burst. The mechanism was the October-pause interpretation of the FOMC minutes — if the Fed holds at its next meeting and the next hike is December, utilities gain a temporary reprieve from the borrowing cost pressure that has been their primary headwind all year. Investors appear to have concluded that the weak September jobs report, taken together with the minutes’ data-dependent language, makes an October hold structurally more likely than a hike.
Small-cap underperformance was the week’s other defining feature. The Russell 2000 fell -0.90% and the Russell Micro Cap declined -1.98% — divergences from the large-cap S&P 500’s +1.17% gain that reflect the distinct interest-rate exposure profile of smaller companies, which carry disproportionately more floating-rate debt and have less access to capital markets during periods of yield volatility. With the 10-year Treasury yield testing levels above 5.30% intraday at several points during the week — continuing the post-hike upward momentum that has pushed rates to their highest levels since the early 2000s — the funding cost reality for small-cap borrowers remained acute despite the October-pause optimism that benefited large-cap defensives. Information Technology fell -0.25% for the week, the only major S&P 500 sector alongside Industrials (-0.40%) to post a weekly decline; the combination of yield headwinds for long-duration technology valuations and profit-taking after the sector crossed 30% year-to-date for the first time in recent history created a natural pause. The S&P 500 Equal Weighted index gained +1.60%, outperforming the cap-weighted index for one of the few times this year — a sign that the week’s gains were broadly distributed across non-technology sectors even as large-cap technology stalled.
International Equities
International developed markets pulled back modestly, with MSCI EAFE declining -0.53% as dollar strength associated with the week’s continued yield pressure and the Hormuz re-escalation weighed on currency-adjusted international returns for U.S. investors. MSCI Germany was the week’s most significant developed-market underperformer at -1.26%, pushing its year-to-date return into negative territory at -1.62% — confirming Germany’s position as the weakest major developed economy in equity terms for 2026, a reflection of the compounding headwinds from elevated European energy costs, export weakness tied to the global industrial slowdown, and the persistent drag from the Hormuz disruption on manufacturing input costs. MSCI Japan slipped -0.31% for the week but retains one of the strongest year-to-date returns among developed markets at +22.14%, supported by the structural corporate governance reform story and relative insulation from Europe’s energy cost pressures. MSCI UK All Cap bucked the regional trend with a +0.63% gain, one of the few bright spots in developed international markets, reflecting the UK’s greater Energy sector exposure in its domestic indices and the positive correlation with the Brent crude surge that the Hormuz reversal triggered.
Emerging markets declined -0.58% (MSCI EM) for the week, though the losses were relatively contained compared to the volatility that the Hormuz reversal could have caused in energy-importing economies. MSCI China fell -0.56%, and its year-to-date deterioration has now deepened to -13.80%, with the trailing twelve-month return at -20.20% — a figure that continues to represent the most severe underperformance of any major equity market tracked and reflects the compounding of domestic economic headwinds, persistent geopolitical risk premium, and the structural burden of elevated energy import costs through the Hormuz disruption. MSCI India Domestic slipped -0.35% for the week, with its year-to-date loss widening to -16.47% — maintaining its position as the worst-performing major market of 2026 by a growing margin. The India story is particularly stark in the context of the Hormuz reversal: if the strait’s physical closure is now described as indefinite rather than temporary, the energy import cost burden that has been India’s primary headwind throughout 2026 has no near-term catalyst for relief, and the Reserve Bank of India’s ability to provide monetary accommodation is constrained by the same inflationary dynamics that have forced other central banks into tightening cycles.
Fixed Income
Fixed income markets delivered a positive week — Bloomberg US Aggregate Bond +0.39%, Bloomberg US Corporate Bond +0.48%, Bloomberg US Treasury +0.31% — despite the 10-year Treasury yield testing multi-decade highs above 5.30% intraday at several points. The apparently paradoxical result reflects the temporal sequence of the week’s events: the FOMC minutes, released Wednesday, confirmed a hawkish committee but reinforced the October-pause interpretation, providing a catalyst for modest yield relief in the second half of the week that more than offset the early-week yield pressure. The Bloomberg US Aggregate Bond’s year-to-date return improved to -2.48% from -2.86% the prior week — the clearest weekly improvement in the index’s annual trajectory since the brief August labor-market-driven bond rally — though the year-to-date loss remains substantial and reflects the cumulative damage of 2026’s sustained rate environment. Bloomberg US Corporate Bonds improved their year-to-date return to -2.66% from -3.13%, with investment-grade credit spreads tightening modestly as the earnings season preview suggested strong corporate fundamentals: a 30.6% earnings growth consensus for Q3 argues against the credit deterioration scenario that elevated rates would normally imply.
The Bloomberg Global Aggregate Float Adjusted index gained +0.03% for the week — essentially flat — as the international fixed income picture was complicated by the simultaneous pull of U.S. October-pause optimism and persistent global rate pressure from central banks that have broadly tracked the Fed’s tightening trajectory. The dispersion within the domestic fixed income universe was notable: Bloomberg US Agency at +0.23% for the week and now -0.91% year-to-date sits dramatically better than Bloomberg US Corporate Bonds at -2.66% YTD, a spread that captures the credit quality and duration profile differences across investment categories. The week’s modest bond market recovery, while welcome for fixed income investors who have endured three consecutive negative-return quarters, remains fragile and entirely contingent on the September CPI print due October 14: a headline at or above 3.6% — consistent with the Cleveland Fed nowcast — would renew pressure on the yield curve and test the October-pause narrative that provided this week’s relief. The bond market’s trajectory for Q4 will ultimately be determined by which story wins: the October pause and earnings-driven soft landing, or a CPI surprise that forces the Fed’s hand before December.
Alternatives & Commodities
Gold advanced +1.30% for the week — its best weekly performance since the August surge that followed the July labor market shock — recovering to -2.87% year-to-date from the -4.12% low reached the prior week. The simultaneous presence of two of gold’s most historically potent supports drove the recovery: the October-pause interpretation of the FOMC minutes reduced the near-term real yield headwind that has been the metal’s primary 2026 drag, while Iran’s Hormuz reversal re-ignited the geopolitical risk premium that had collapsed on the prior week’s diplomatic optimism. The combination delivered a week in which gold’s competing headwinds — rising real yields and fading safe-haven demand — both reversed direction simultaneously, creating a rare alignment of positive catalysts. The metal’s year-to-date recovery from -4.12% to -2.87% in a single week illustrates both its sensitivity to the policy narrative and the degree to which the gold market has become a referendum on the Fed’s 2026 forward path: every data point that reduces additional hike probability translates almost immediately into gold price support.
Energy’s +3.62% weekly gain — driven by Iran’s Hormuz reversal and Brent crude’s return above $107 per barrel — was one of the sector’s strongest performances of Q4 to date and pushed its year-to-date return to +48.45%, the highest of any S&P 500 sector in 2026 by an expanding margin. The week’s Energy narrative is the inverse of the prior week’s: where the UN General Assembly signal had briefly introduced the possibility of a Hormuz resolution, the re-escalation confirmed that the physical supply constraint driving 2026’s dominant sectoral theme is not only intact but arguably more entrenched than at any point since the conflict began. For investors who had reduced energy exposure on the prior week’s diplomatic signals, the reversal arrived with unusual speed — a reminder of the asymmetric risk profile of the Hormuz disruption story, where diplomatic signals reverse quickly but physical supply infrastructure takes months to restore. Real estate investment trusts (FTSE NAREIT Composite) gained +1.19% for the week, improving their year-to-date return to +8.00% as the October-pause narrative provided the rate relief that REIT valuations have required throughout a year in which rising Treasury yields have been their persistent headwind. The sector’s recovery this week, like Utilities’, is entirely a function of the October hold interpretation — and like Utilities’, it remains fully reversible if the CPI print due October 14 changes the calculus.
Source: Morningstar