
Economic Data Watch and Market Outlook
The S&P jumped 1.35% for the week as the index crept just over 7% MTD. For context, stocks in October have risen on average just over 3.5%. Granted, the growth we’re seeing is largely due to recovery from the pandemic, low rates, and lack of other opportunities.
The G20 will be meeting in Scotland to discuss a global corporate tax and address climate change.
Labor shortages continue to make headlines in the US but with apparent resolutions on previous noted labor strikes, clarity on COVID booster shots, and approval of vaccine for children ages five to 11 years-of-age, we are hopeful that some tightness in the labor market may ease further in the coming months.
Earnings releases provided the usual confusion as prices moved in erratic patterns. On average, most companies performed quite well in the third quarter. Price declines were often characterized by analysts stating “conservative guidance” going forward. This is common when analysts cannot adjust their models for high valuations pushed by investor enthusiasm. Third quarter GDP was modestly soft at 2% versus expectations of 2.8%. This too is a double-edged sword as it continues to raise questions about how soon and the degree of tapering by the FOMC. The softness in oil prices was basically ignored as more analysts discussed there were no supply shortage issues and overall refining efficiencies have improved over the past few years. Free cash flow appears to be strong for most large cap companies. The next few years will see improvement in lower interest expenses and probably more aggressive stock buy-back programs.
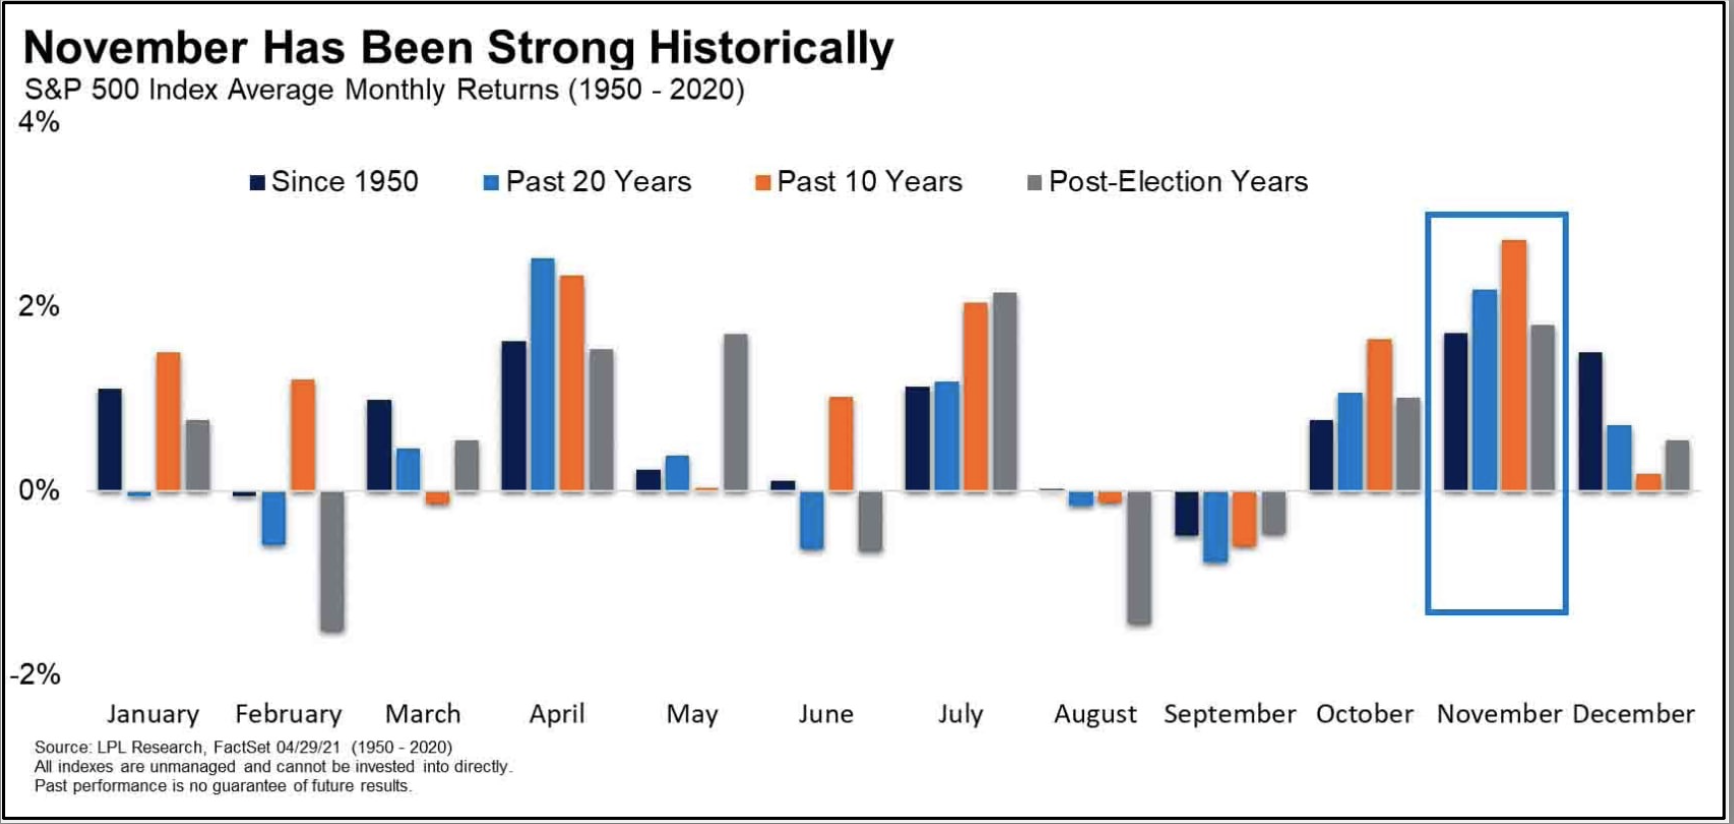
Overall, expectations are for a front loaded and very strong holiday shopping season this fall. With this in mind, November already been historically a strong month for stocks as noted in the graphic below:
This week we are expecting an array of data globally. Highlights include Housing, Manufacturing, and GDP data from the US, German Unemployment, Retail data from Japan and Industrial results out of China.
U.S. Equities
The Russell 1000 rose 1.14% for the week , up 6.94% for the month. S&P noted above is up just over 7%. Growth stocks were the key driver this week as the Russell 1000 Growth advanced 2.6% while value stocks fell. ( Russell 1000 Value, -0.44%). Consumer Discretionary, Health Care and Technology advanced, 4.34%, 1.62%, and 1.98% respectively.
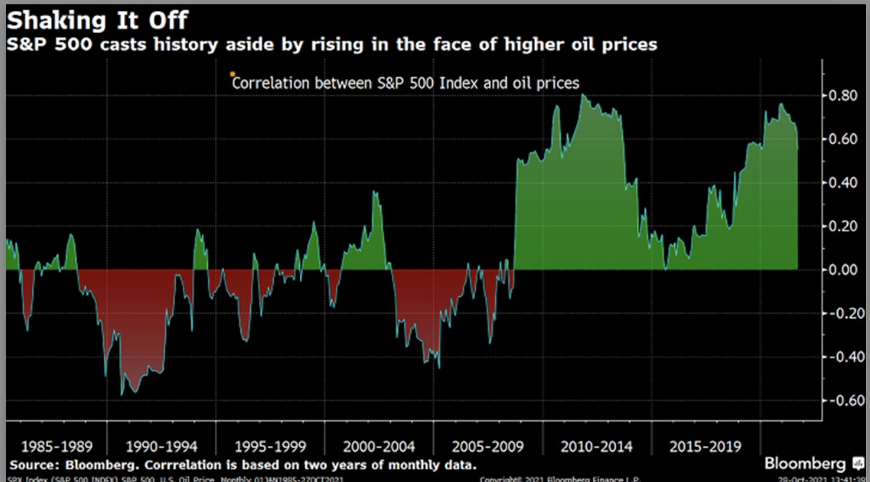
We’ll discuss the energy sector a bit more later in this piece but as we’ve noted before it’s a small part of the S&P 500, at just 2.87% . For context, it was over 16% at its peak in 2008. Despite this, the S&P has maintained a high correlation to oil as the sector has gotten smaller. This is likely due to the expanding wealth of consumers and businesses due to other sectors that provide them with capital to continue economic growth. Energy stocks are up 56.67% year to date.
Small cap stocks rose a modest 27 basis points for the week, adding to the year-to-date result of 17.19%.
International Equities
Developed markets were flat and the MSCI EAFE benchmark fell just 11 basis points. Emerging markets fell sharply, down 2.18%. Eyes are on China as they have reported a 75.8% vaccination rate but are still making headlines regarding COVID outbreaks. They also continue to deal with a looming debt crisis started with developer, Evergrande, and others that are reporting that they may potentially have issues repaying their debt. Perhaps related, President Xi’s was expected to attend the G20 in person but has reversed that decision and will attend via video.
Fixed Income
True to form, the benchmark US Treasury market appeared to frustrate many participants by its recent behavior. Despite a broader consensus that inflation appears to be more stubborn than originally thought, longer dated bond yields actually fell with the benchmark ten-year Treasury yielding just over 1.55% from a high of close to 1.80% earlier in the year. Conversely, shorter dated issues continued to post higher yields with the two-year Treasury virtually doubling its yield to just over .50% from an earlier low of less than .20% earlier in the year.
The implied flattening of the yield curve would seem to suggest that inflationary pressures will abate in the coming months while the Federal Reserve is expected to remove much of the monetary stimulus enacted during the onset of the pandemic. That being said, supply chain bottlenecks and upward pressure on wages continue to weigh on sentiment and have dampened estimates for earnings growth rates in the immediate future – perhaps portending a broader trend towards normalized GDP growth and inflation in 2022.
Hedge Funds
Hedge Funds were modestly net bought again, drive mainly by short covers in Marco Products (Index and ETF combined). Managers rotated into Europe (largest net buying in 5 weeks) and de-grossed in North America (short covers > long sales), while net flows diverged between EM Asia (2nd straight week of net buying) and DM Asia (largest net selling in 5 weeks).
Single Names saw little net activity but there was active sector rotation – Financials, Consumer Discretionary, and Utilities were the most the money net bought global sectors, while Communications Services, Industrials, and Info Tech were the most net sold. Hedge funds moved into Financials and further out of TMT stocks amid a flatter yield curve – driven by higher front-end rates – and a busy week of earnings including results from FAAMG and European Banks.
Regional rotation continued into European equities for which long/short ratio rose to a multi-year high. European stocks were net bought for a second straight week (five of the past seven) and saw the largest net buying in five weeks, driven by broad-based activity across most sectors and markets.
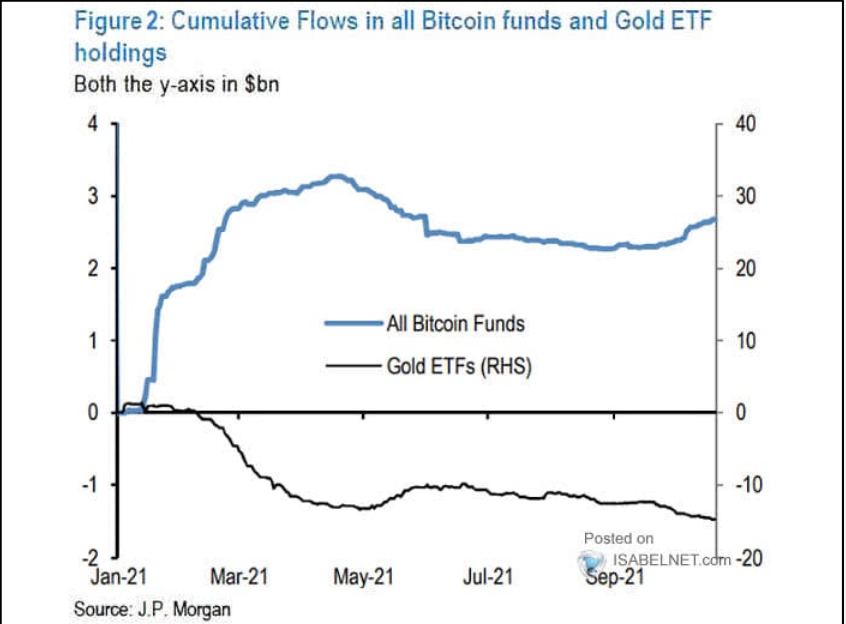
Bitcoin (BTC) is off its all-time high per coin but hovers above $60,000. ProShares launched their Bitcoin Futures ETF two weeks ago and a growing interest continues (see figure below) as funds flow into Bitcoin funds such as Grayscale’s GBTC relative to gold ETFs.
Early data shows that the Bitcoin Futures ETF has not performed in lockstep with the asset and the ETF can also be subject to contango and backwardation because the fund purchase rolling futures. Currently, shorter term futures are priced lower than longer dated futures. When shorter dated futures are sold a higher price longer dated contract is purchased (contango) and there tends to be a performance gap.
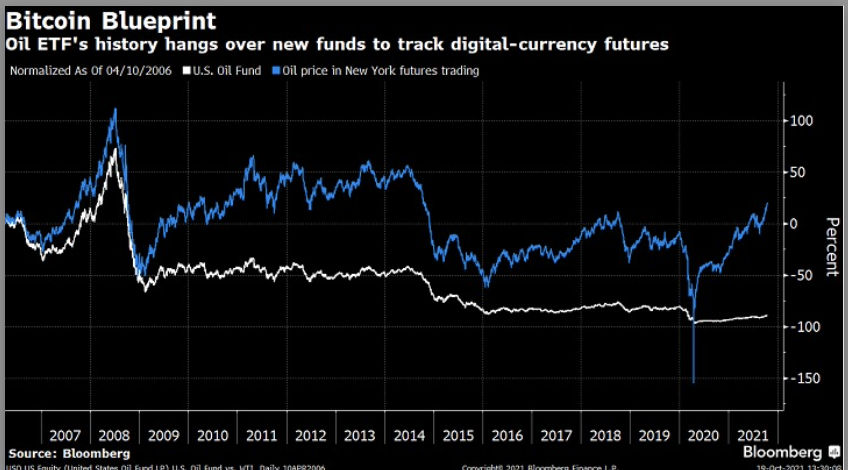
While no proxy exists over the long term for BTC, we can use USO as a guide. USO, the ETF tracking oil versus its NY Futures price (see figure below) has typically had dissimilar performance to that of its futures benchmark. Both BITO and USO provide fair warning in their documentation that the performance of their respective ETFs will likely not track the respective asset.
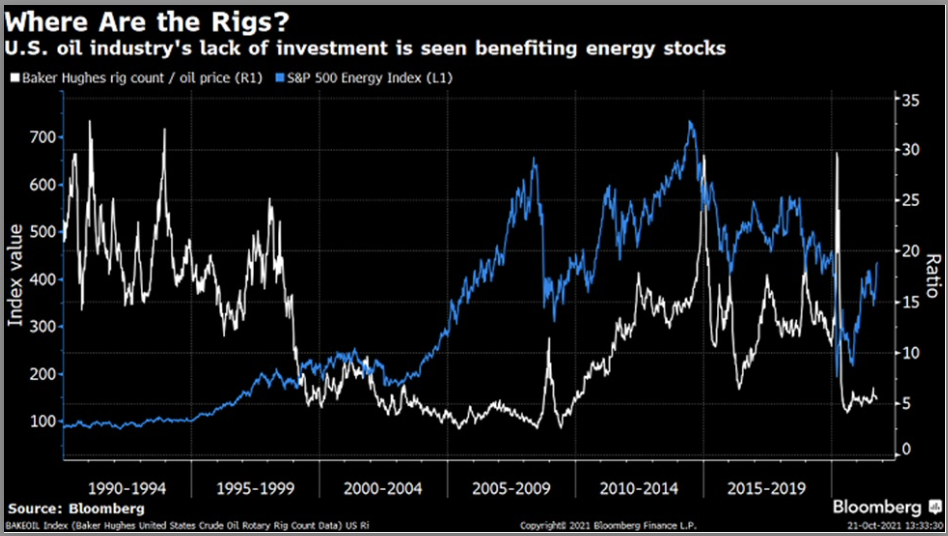
Despite the softening of oil prices, gas prices continued to climb as the national average currently stands at $3.40 per gallon. As we discussed in the equity section, energy stocks have had significant performance year-to-date up almost 57%. With so much attention being put on climate change and investment in renewables, we can look at the drop in rig counts as an indicator of how investment has been lacking in the fossil fuels space (see figure below).
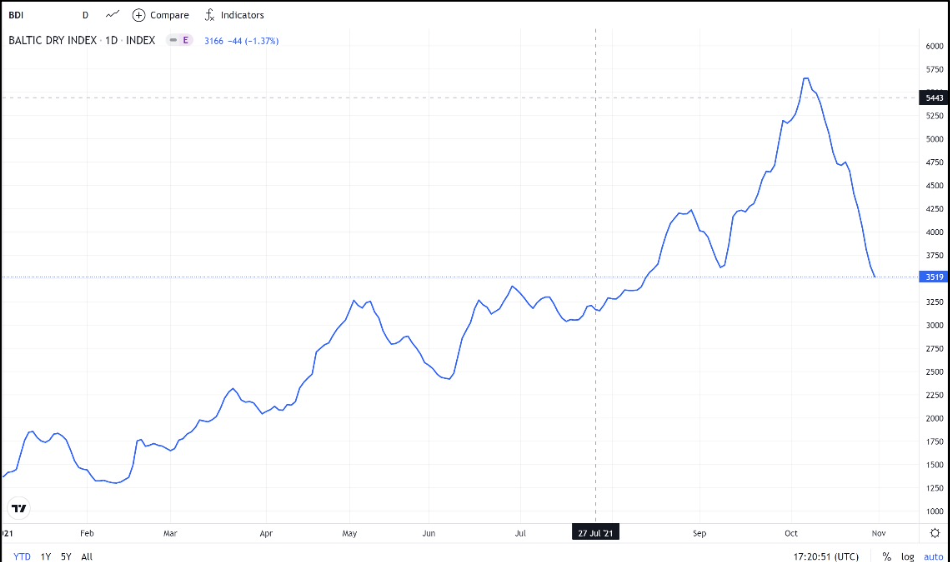
Another indicator is coal as surging prices have hampered factory output in China. The price of power is regulated by the government which has been hesitant to raise prices, leaving the utilities exposed to the commodity. As a result, they have cut off or slowed the production of electricity. China intervened and as indicated in the figure below the Baltic Dry Index, which is a key indicator in SHIPPING the commodity, fell sharply.
Data Source: AAA, Bloomberg, The Daily Shot, Factset, Financial Times, Kiplingers,US Federal Reserve, HFR (returns have a two-day lag), Morningstar, Pension and Investments, Proshares, Standard & Poor’s, Trading Economics, USCF Investments, and the Wall Street Journal
This report discusses general market activity, industry, or sector trends, or other broad-based economic, market or political conditions and should not be construed as research or investment advice. It is for informational purposes only and does not constitute, and is not to be construed as, an offer or solicitation to buy or sell any securities or related financial instruments. Opinions expressed in this report reflect current opinions of Clearbrook as of the date appearing in this material only. This report is based on information obtained from sources believed to be reliable, but no independent verification has been made and Clearbrook does not guarantee its accuracy or completeness. Clearbrook does not make any representations in this material regarding the suitability of any security for a particular investor or the tax-exempt nature or taxability of payments made in respect to any security. Investors are urged to consult with their financial advisors before buying or selling any securities. The information in this report may not be current and Clearbrook has no obligation to provide any updates or changes.