
Economic Data Watch and Market Outlook
While U.S. equity markets ended roughly flat on the week, with the S&P 500 down just 18-basis points, equities gyrated mid-week as the Fed raised the Fed Funds rate, as expected by 50-basis points. The S&P reversed from a low of 4159 to close just under 4300 on Wednesday after the announcement from Chairman Powell suggested that it was highly unlikely that the Fed would raise rates by 75-basis points during the cycle. He continued to say 50-basis point increases were likely for some time before we see a 25-basis point increase. As traders digested the news overnight, Thursday saw a drop in the S&P 500 of roughly 190 points. Further, the S&P had two of its worst days since June 2020 and its best day since May 2020.
Real estate stocks were hardest hit, dropping more than 3%, as the Fed Fund rate increase and rising mortgage rates curtailed future expectations in the sector. Construction spending ticked down 10-basis points, missing estimates of a 70-basis point increase. It should be noted that the result is subject to revisions, but a negative number is a notable reversal. Consumer Discretionary stocks declined just under 3%. We’ll discuss large contributors in the equity highlights. The upcoming week will reveal more about the housing market as an update on Mortgage Applications is released.
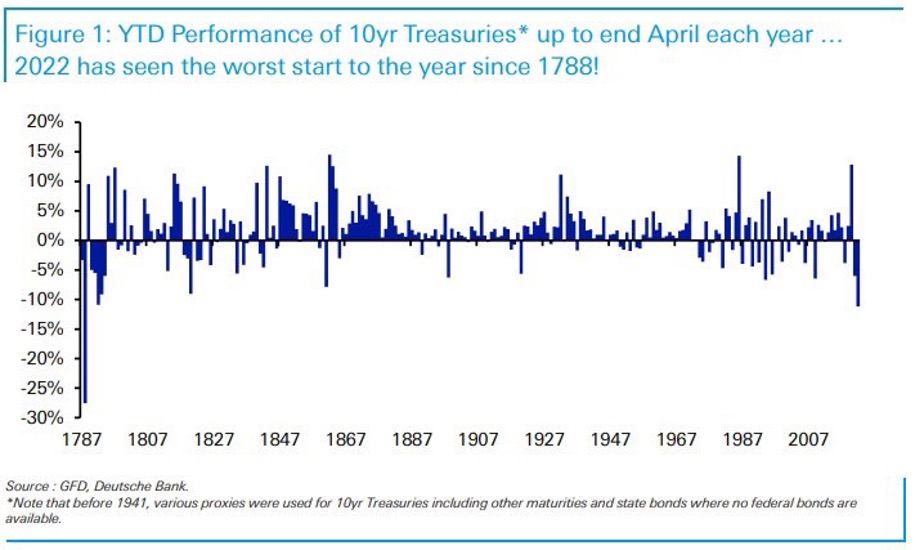
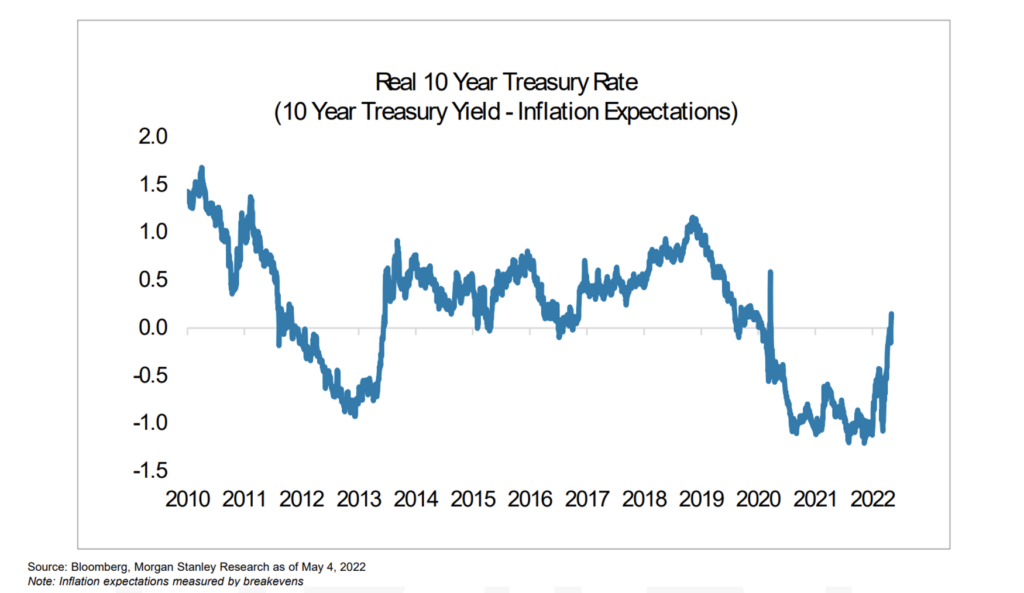
Looking back at bond markets, we’ve seen how impactful inflation has been in the chart below showing we are off to the worst year-to-date start since 1788. The aggressive stance of the Fed has caused real yields in the 10-year have to turn positive with the expectations that this should continue.
Nonfarm payrolls were released on Friday and expanded more than expected as (428k vs 391k estimate) but there was no change in hourly wages year over year versus the estimate, a 5.5% increase. What was notable, however, was the slight decline in the labor participation rate from 64.4% to 64.2%.
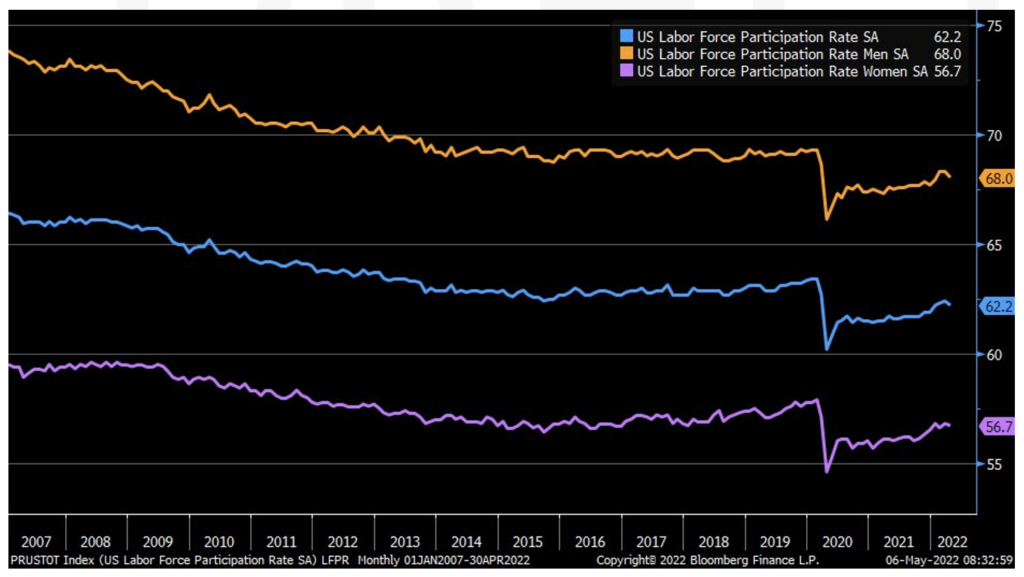
The Bureau of Labor Statistics released their JOLTS (Job Openings) for the month of March. 11 million was the estimate but the report showed 11.549 million openings. It’s been suggested that the lack of participation has been due to increased wealth causing a desire to NOT work. Note that the JOLTS report was for March and likely we’ll see different dynamics in labor markets going forward as concern grow about the health of the economy.
Mid-week we’ll learn more about energy inventories. The current administration has released oil from the strategic reserves but despite that, gasoline prices have continued to increase. Thursday we’ll see Producer Price Index results as well as jobless claims. We’ll also see a variety of global inflation and GDP results.
Equities
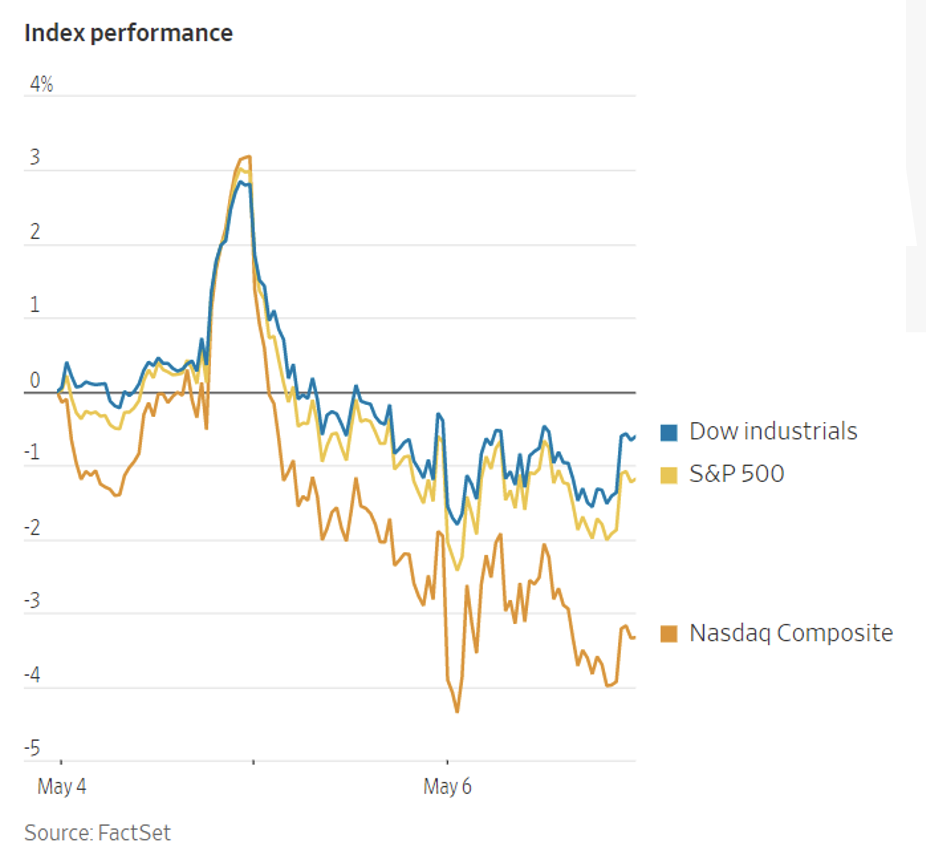
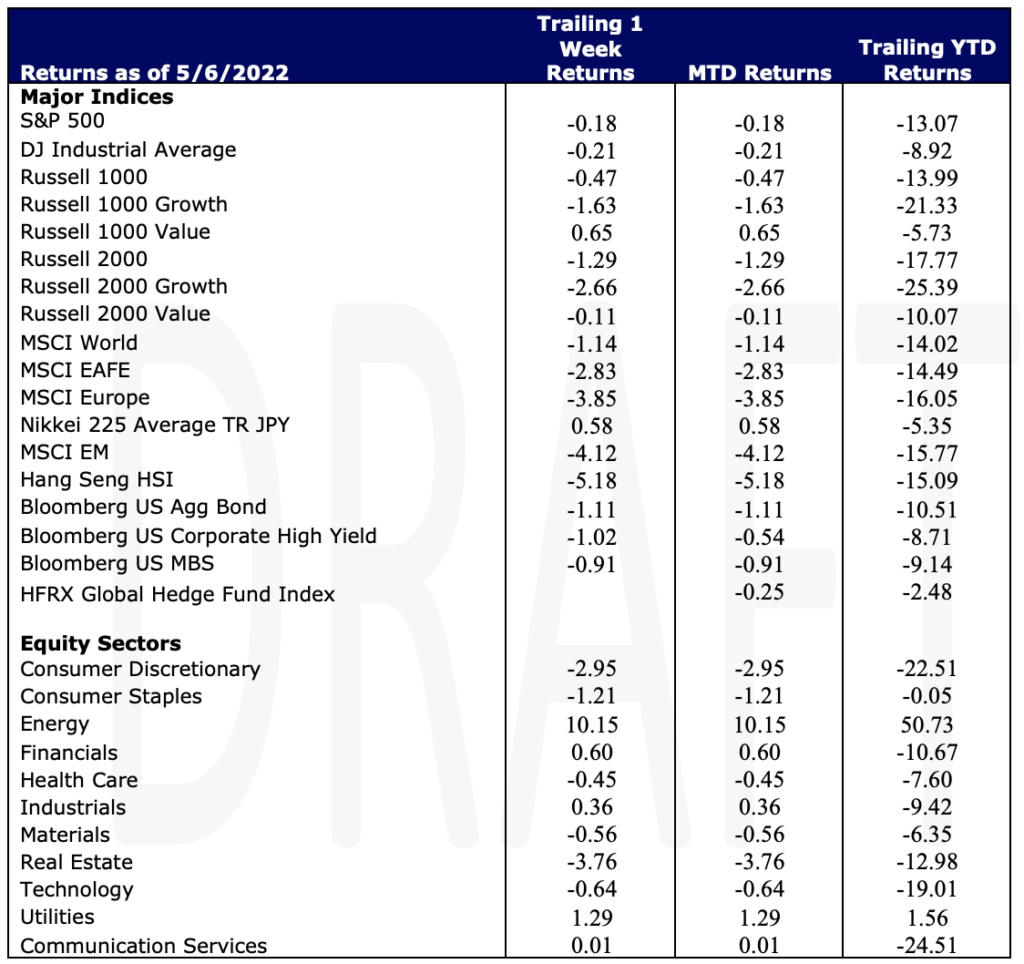
U.S. Equity indexes extended losses Friday after seeing an extreme whipsaw throughout the week. Investors are attempting to measure the impact of the Fed’s plan to raise interest rates as well as considering the implications of the latest U.S. jobs data release on Friday – a particular concern is that rising wages could fuel inflation which could then prompt workers to demand even higher wages, causing an upward spiral. The S&P 500 and Nasdaq both ended the week in negative territory for the 5th consecutive week – the longest streak since 2011 and 2012, respectively. The Dow Jones dropped for its sixth consecutive week while posting both its best and worst days since 2020. The S&P 500 dropped nearly 4% on Thursday, erasing gains from earlier in the week including a 3% gain on Wednesday. For the week, the S&P 500 ended down 0.18% while the Dow Jones ended down 0.21% and the tech-heavy Nasdaq ended down 1.54% on the week and -22.4% on the year.
As it’s been all year, Technology stocks did worse than the broader market on Friday but had only modest negative returns on the week -0.64%. E-commerce stocks in particular were the underperformers; Amazon and Shopify finished the week down roughly 7.7% and 11.6%, respectively. Real Estate -3.76%, Consumer Discretionary -2.95%, and Consumer Staples -1.21% were among the biggest losers on the week while the Energy sector +10.15% significantly outperformed all other 11 S&P sectors – Oil prices rose again on Friday, a positive for energy stocks but also leads to worries about slowing economic growth and higher inflation. Overseas, benchmark indexes in both Asia and Europe retreated Friday, tracking losses in the US with the most declines coming from the tech-heavy Hang Seng Index which slumped 5.18%. In Europe, the MSCI Europe ended down 3.85%. The MSCI World ended the week down 1.14%.
Fixed Income
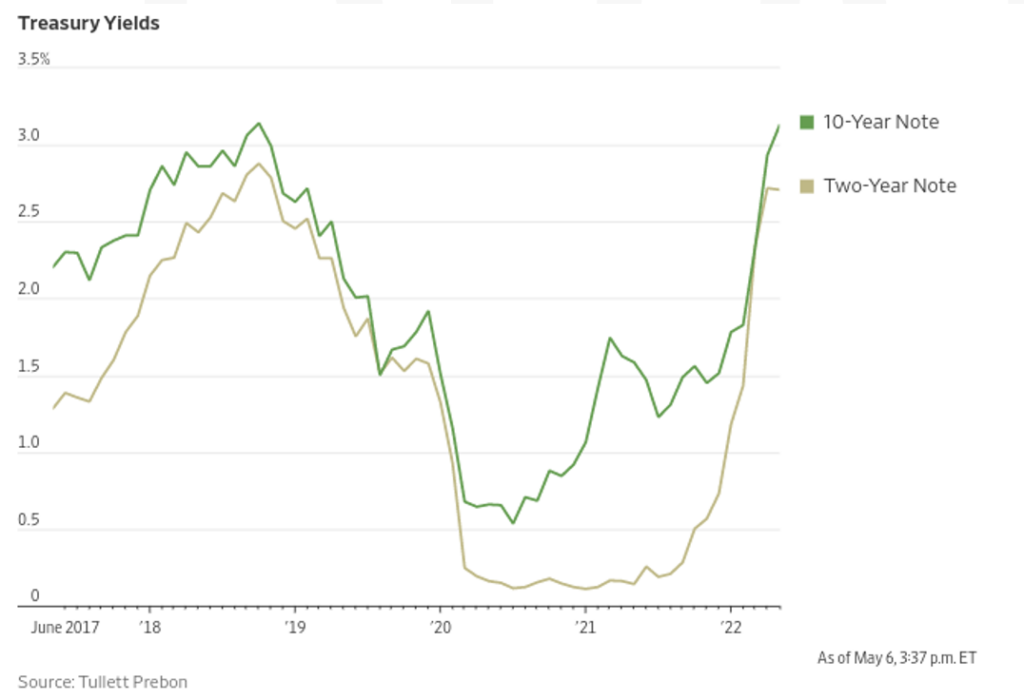
Following the Fed meeting on Wednesday, which concluded in a 50-basis point rate hike, the yield on the 10-year Treasury finally surpassed the 3% mark which is the first time since 2018. The 50-basis point rate hike is the largest increase since 2000 and the first time since 2006 since the Fed increased rates in back-to-back meetings. The Fed’s goal seems to be to raise rates until they reach the 2.5-3% range. Interest rate derivatives are forecasting the Fed funds rate to reach 3.5% sometime next year compared to the current .75% – 1% range. As long as inflation is still rising, we can expect rates to continue to rise but if it starts to cool, there are expectations that short-term rates can stay under 3% but could go as high as 5% if inflation continues to heat up. There has been an exodus out of long-duration bonds and junk bonds and into safer forms of debt. The SPDR Portfolio Long Term Corporate Bond ETF saw its biggest single day drop since the massive sell off on March 19th amid the start of the pandemic while the iShares High Yield Bond Factor ETF dropped to its worst day since June 11, 2020 this week. The large moves in bond prices are in part effected by hedge funds closing out due to Treasury yields surpassing set target rates. Treasury yields were impacted early Thursday partially due to a large order of new corporate bond sales that were triggered in the AM on Thursday. In conclusion, there is a lot of uncertainty in the market leading to some major volatility across all areas of the bond market which is becoming the norm this year and is expected to continue until we get more clarity around inflation and geopolitical issues.
Russia avoided a default this week by making payments on March 4th in US dollars from the country’s reserves. There was $640 million due originally on April 4th but had a 30-day grace period to make the payment before default. On Tuesday, the Credit Derivatives Determination Committee met to determine if investors who bought credit default swaps could start making claims on Russian debt. They concluded that Russia had made payment and they are continuing to monitor the situation. Russia has approximately $40 billion of international bonds still outstanding and will struggle to make payments post May 25th when the US Treasury Provisions allowing debt interest and repayments expire. The credit reference agencies who would normally rule on whether a country has defaulted are banned from covering Russia due to the EU sanctions.
Hedge Funds
Hedge funds are off to a challenging start for the month of May, as most major strategies posted losses after the first four days (to note hedge fund data is from Friday to the following Thursday) with most of the losses coming on Thursday. US long/short funds are off to an awful start, down ~1.5% with the S&P positive through Thursday. The spread between crowded longs and shorts finished the week -3.7% as longs were down 2% and shorts were unfortunately up 1.7%. This is the widest weekly spread since shorts rallied in January 2021. The spread between crowded stocks in Europe and Asia were positive even with longs underperforming their respective benchmarks. Europe is the top performing region YTD as funds are down ~ 40 bps while the Euro STOXX 600 is down 8.7%. Hedge funds were small net buyers for the week, but long/short funds trimmed gross exposure slightly and were the only strategy to do so. With these small trims and mark-to-market moves, U.S. and EU long/short funds’ gross exposures are at the lowest levels in the past 12 months. In North America, tech and financials saw most of the selling. Not surprising, defensive sectors such as consumer staples and healthcare saw inflows. On the short side, funds covered shorts across most sectors. The EU had the most net buying and it was spread across strategies. Flows leaned towards all cyclical sectors as well as healthcare and financials. Flows in AxJ and Japan were muted for the week.
Private Equity
In recent years there has been a rush into venture capital by non-traditional investors, hedge funds and corporate venture arms. Sometimes called “tourist investors”, nontraditional investors are defined as institutions that do not typically invest in venture capital. In 2021, tourist investors’ participation reached over 78% of total US VC deal value equating to $268.3B which has played a major role in driving up deal prices across the venture space. However, now given high market volatility and rising interest rates many, of these firms, especially firms that invest in both public and private companies, are starting to retreat from investments in venture backed startups.
VC deal volume with nontraditional investor participation in Q1 of 2022 was only $52.5B, substantially less than any quarter of 2021. However, the pullback seems to be an aversion to larger late-stage deals with private equity firms and hedge fund asset managers showing the highest degree of pullback. Analysts expect nontraditional investors to become much more cautious which will translate to slower deal activity than what was seen in 2021.
Data Source: Bloomberg, BBC, Charles Schwab, CNBC, the Daily Shot HFR (returns have a two-day lag), Jim Bianco Research, Market Watch, Morningstar, Pitchbook, Standard & Poor’s, the Wall Street Journal, Morgan Stanley, Goldman Sachs and IR+M
This report discusses general market activity, industry, or sector trends, or other broad-based economic, market or political conditions and should not be construed as research or investment advice. It is for informational purposes only and does not constitute, and is not to be construed as, an offer or solicitation to buy or sell any securities or related financial instruments. Opinions expressed in this report reflect current opinions of Clearbrook as of the date appearing in this material only. This report is based on information obtained from sources believed to be reliable, but no independent verification has been made and Clearbrook does not guarantee its accuracy or completeness. Clearbrook does not make any representations in this material regarding the suitability of any security for a particular investor or the tax-exempt nature or taxability of payments made in respect to any security. Investors are urged to consult with their financial advisors before buying or selling any securities. The information in this report may not be current and Clearbrook has no obligation to provide any updates or changes.