Economic Data Watch and Market Outlook
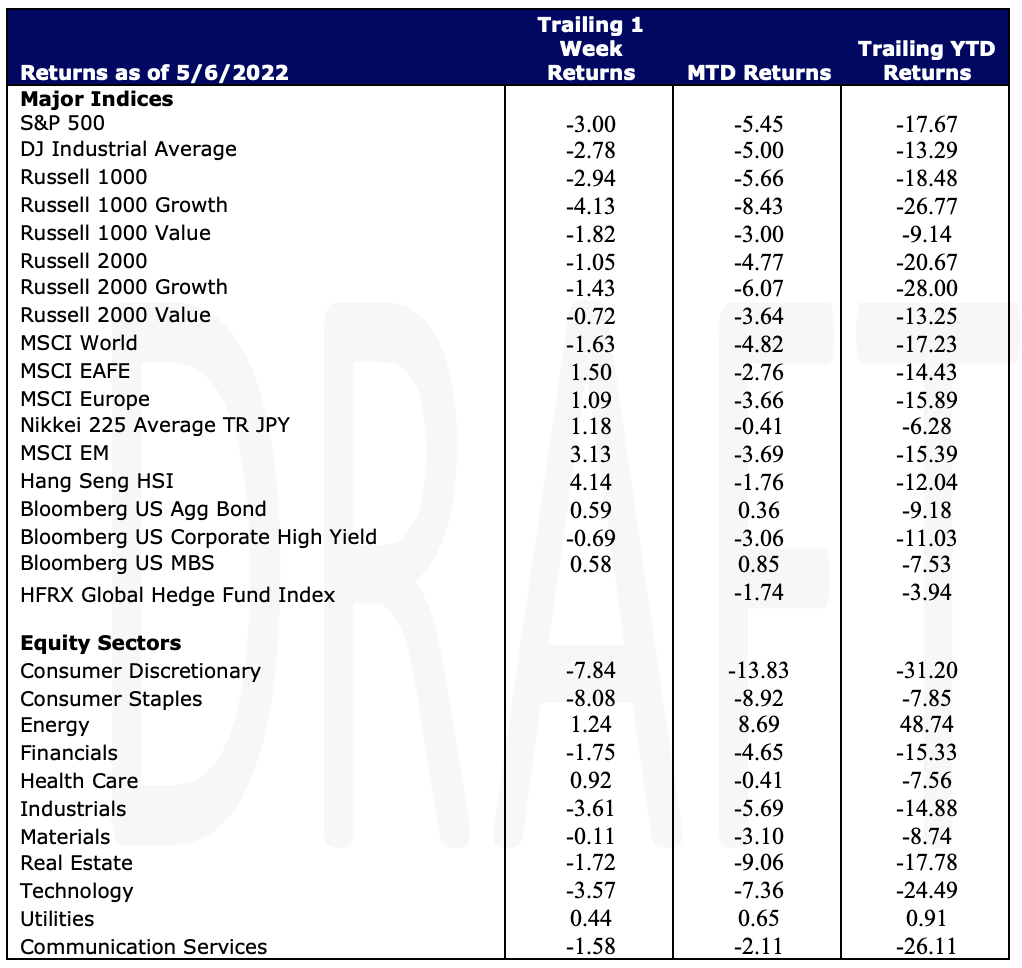
Global equities prices fell 1.63% for the week. International stocks rose 1.5% in dollar terms while US stocks plunged approximately 3%. US Bonds advanced 59 basis points. Investors continued to worry that the Fed would not be able to manage a soft landing and like US equities, high yield bonds also fell 69 basis points.
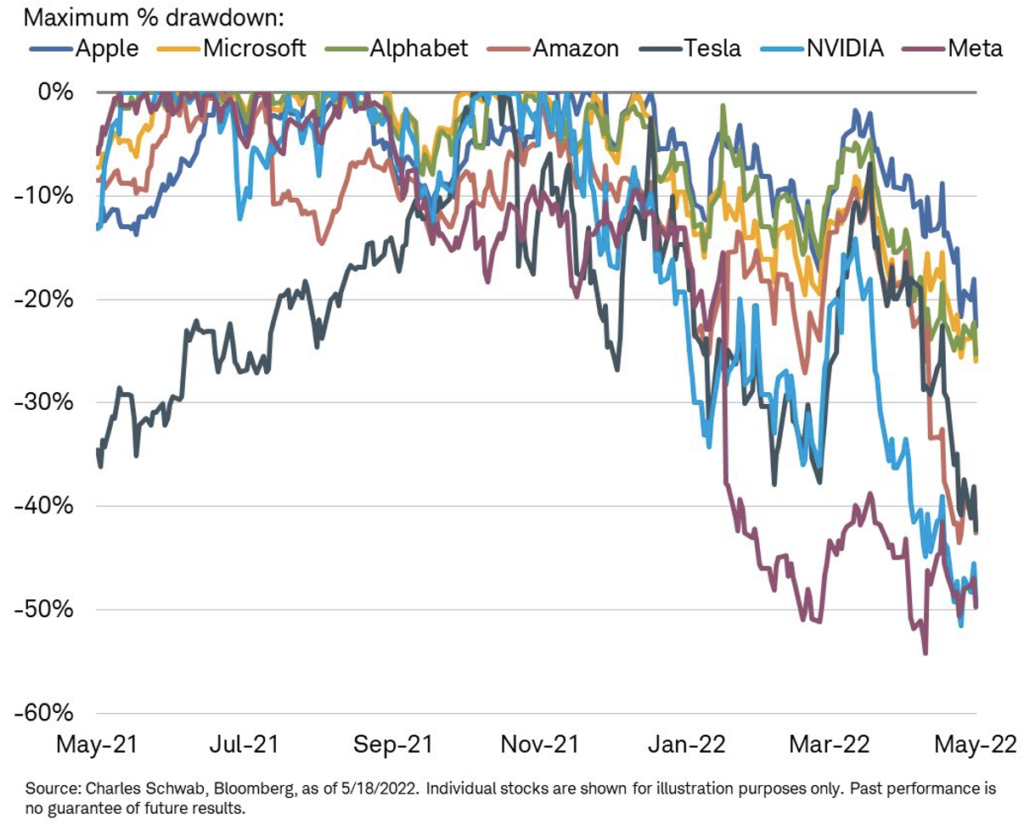
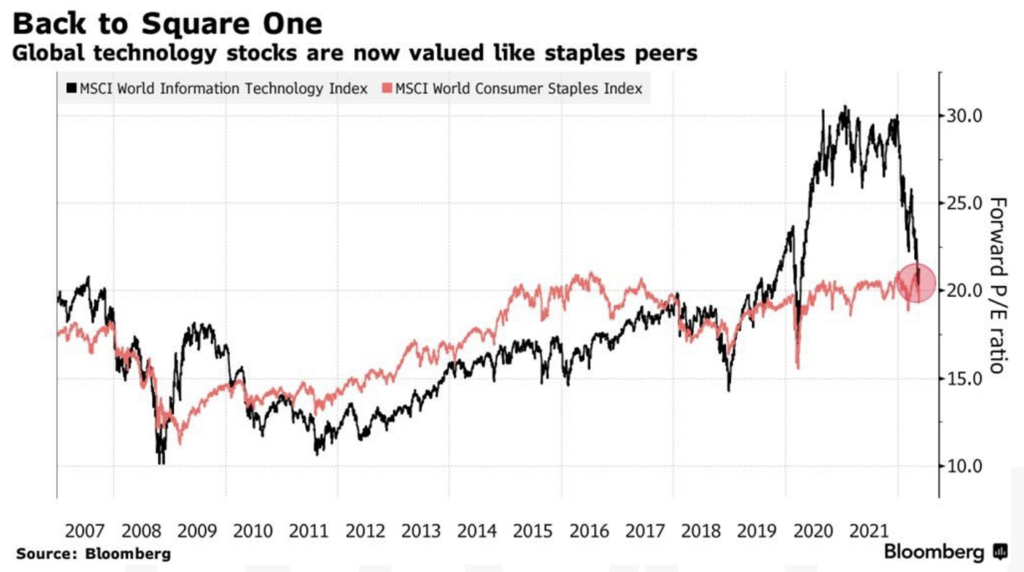
US Tech stocks are down almost 25%. Are they an attractive opportunity?
Forward-looking, global tech stocks are now valued similarly to global consumer staples (see chart below). We continue to monitor valuations in the space but expect to proceed cautiously.
We also continue to watch the consumer. Year over year retail sales rose 8.19% versus the previous months’ 7.34% rise. Core retail sales came in higher than expected at 0.6% versus estimates of 0.4%. Most of the spending is related to services as consumers are getting out and travelling.
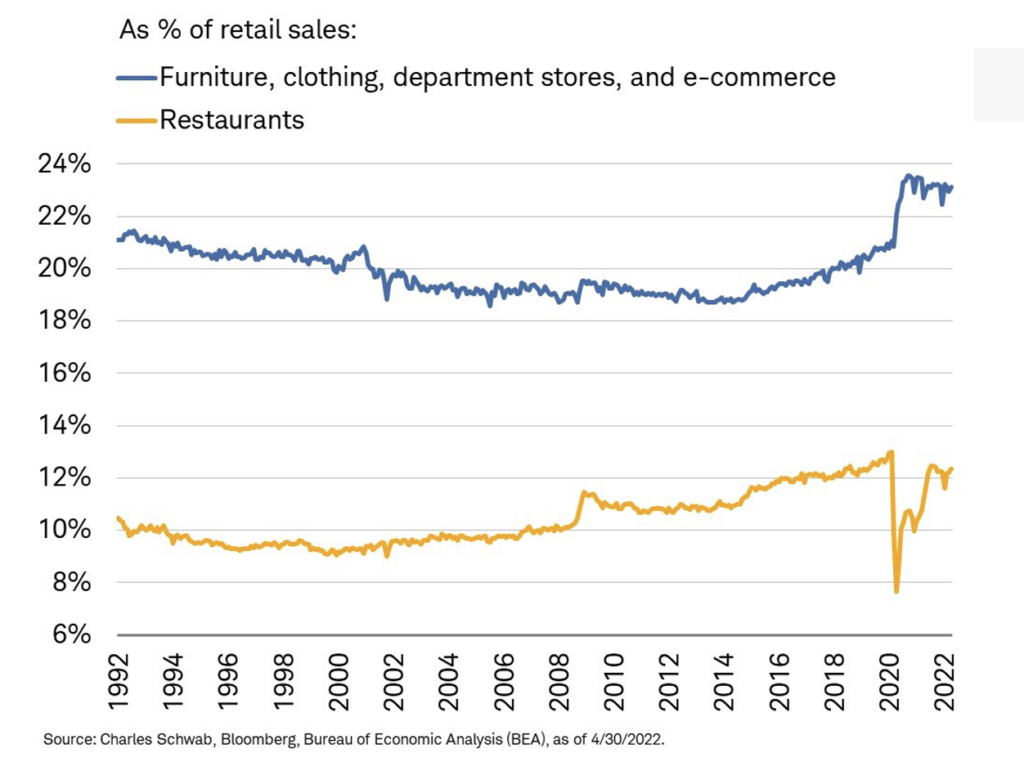
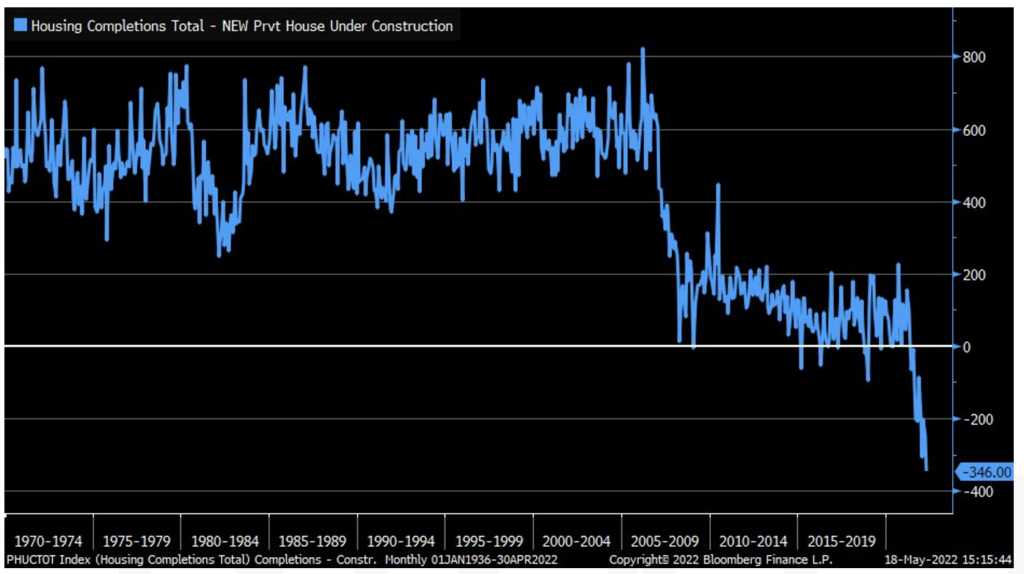
Consumers continue to spend but as rates have risen to an average of 5.49%, we’re seeing a clear deterioration in home sales. Mortgage applications week over week plunged 11.0%. Housing completions relative to starts has plunged as well.
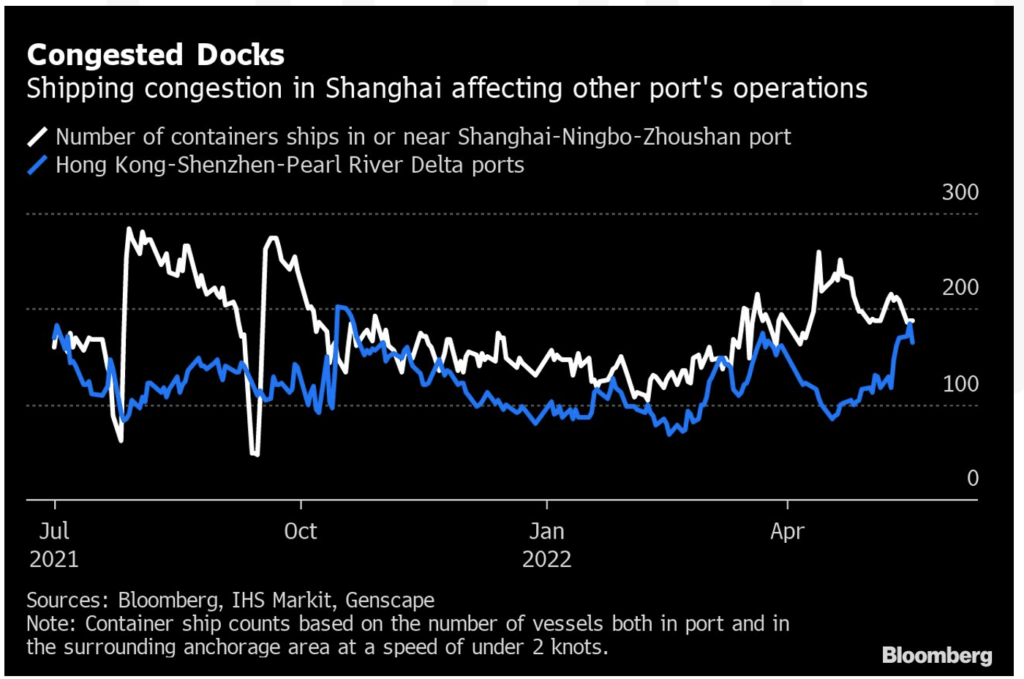
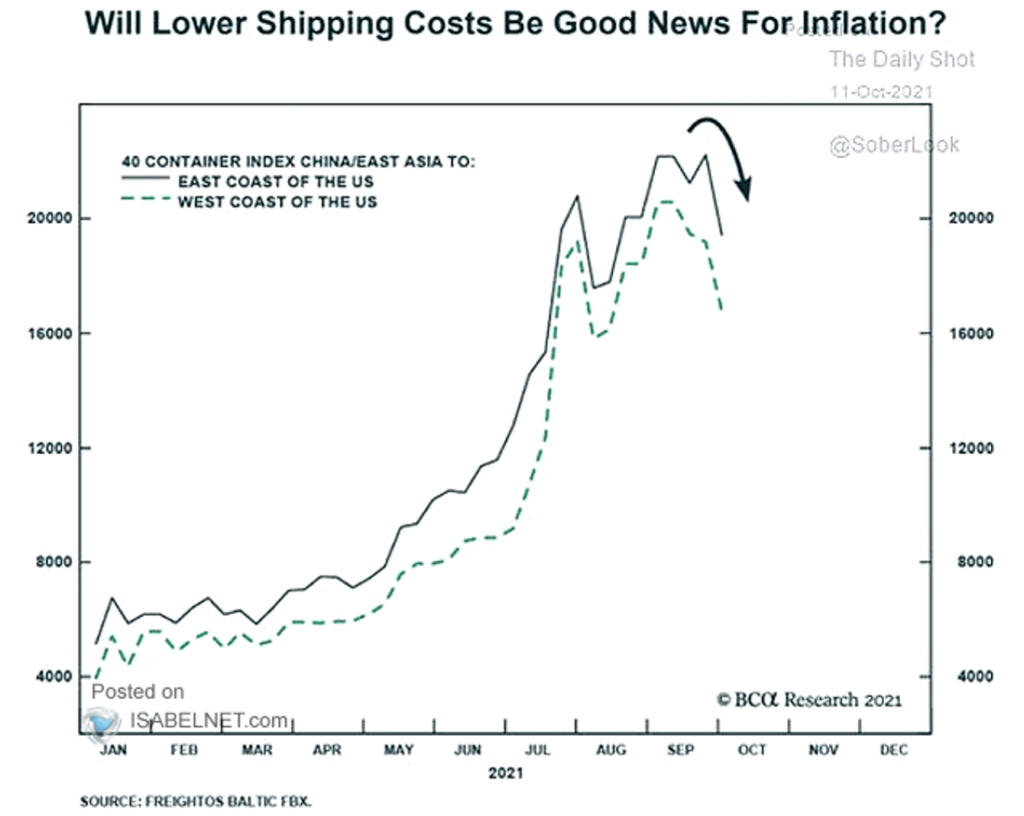
We are hopeful that if any of the COVID-related “transitory” inflation is still affecting prices, there are signs they are starting to wane. Note the easing of the ports in Shanghai and the drop in container prices.
Equities
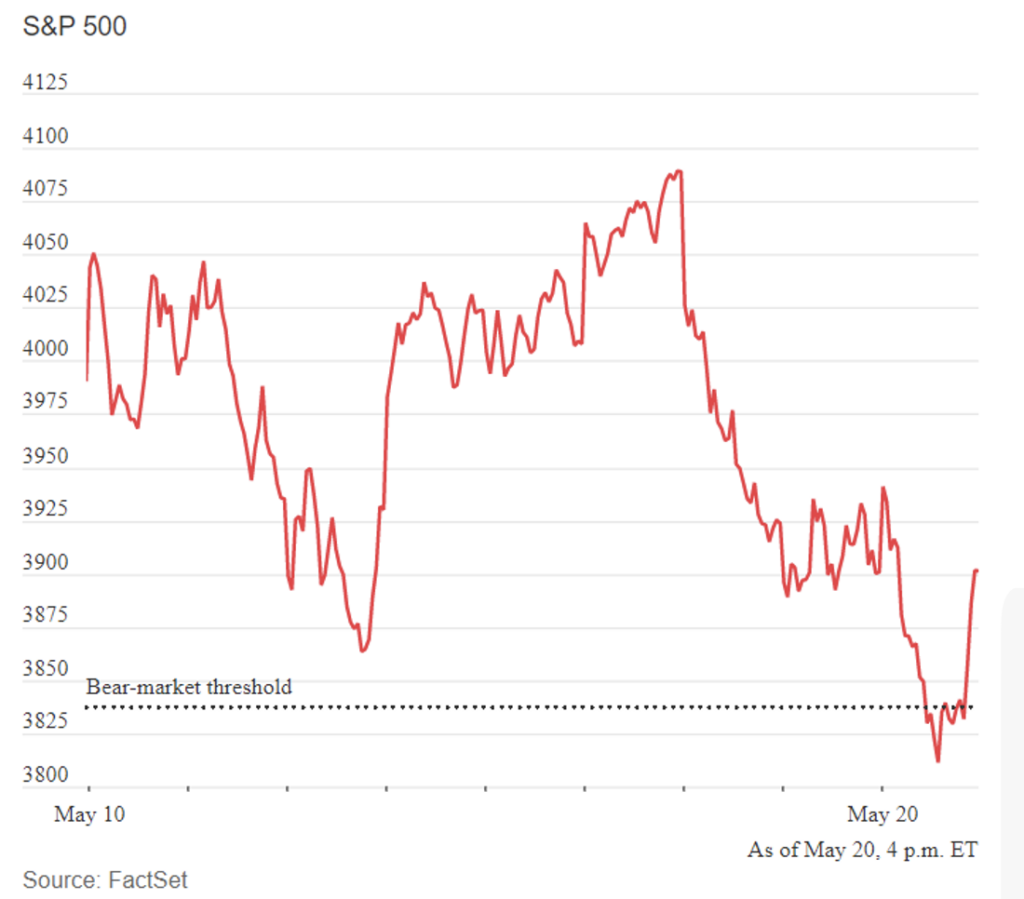
US Equities logged steep weekly losses this week. This decline led the S&P 500 to post its longest weekly losing streak since the dot-com bubble burst. Tighter monetary policy and inflation effects on the economy and corporate profits continue to concern investors. The S&P has come close to -20% below its recent record high, indicating bear market territory – the first since the early days of the COVID-19 pandemic in 2020. That said, a comeback in the final hour of trading on Friday pushed the index higher.
The Nasdaq plunged nearly -4% on the week adding to its losses after falling into bear market territory earlier this year as traders again rotated away from growth stocks amid expectations of rising interest rates. As of Friday, the Nasdaq has fallen nearly 30% from its record high. The Dow Jones fell -2.78% this week also adding to its correction territory losses and eighth straight week of losses – the longest streak for the Dow since 1932, near the height of the Great Depression. As mentioned, investor sentiment remains around the health of the economy due to inflation which has been shown in earnings reports – more specifically, Walmart and Target had their worst one-day decline since the Black Monday crash of 1987. The retailers reported their profits being hurt by rising costs and supply chain disruptions. Ross also became the latest major retailer to cut its full-year guidance highlighting the impact inflation and supply chain disruptions have had on profits. Shares of Ross slumped -22%. Tesla had a very bad week as the company was removed from the S&P 500 ESG index over concerns of business conduct, lack of low-carbon strategy, and reported racism and poor working conditions at Tesla’s factory in Fremont, California – adding to the already negative news from Musk’s bid to buy Twitter that is now temporarily on hold. Tesla’s shares have declined nearly 40% this year wiping out approximately $342 billion in market cap. Stocks in the Consumer Discretionary sector plunged -7.84% while those in Consumer Staples also took a beating, losing -8.08% on the week amid a plunge in the aforementioned shares of large retailers. Energy 1.24%, Healthcare 0.92%, and Utilities 0.44% were the only sectors logging a positive return this week. Globally, stocks ended the week mixed; the MSCI World dropped -1.63%, Europe gained a little over 1%, Emerging Markets and Hong Kong outperformed with positive weekly gains of 3.13% and 4.14%, respectively.
Fixed Income
Treasury yields continued to drop this week adding onto last week’s decline in yields throughout the curve. The 2-year Treasury yield fell 11.5 basis points over the 2-week span while the 10-year Treasury yield fell to its lowest level since April 26th. Both Treasuries had their largest 2-week drop in yields since the week ending April 3, 2020. The 30-year Treasury Bond fell 22.6 basis points over the last 2 weeks but only saw its worst week in yield decline since December 3, 2021. With bonds having their worst start to the year in 40 years it is offering opportunities to buy bonds as prices are near historic lows. Bond market pricing has it looking closer to a bottom than equities right now, but the risk is still gauging how aggressively the Fed will raise rates to quell inflation. The yield on corporate bonds over Treasuries has risen to 4.4% compared to 32% below the median at the start of the year. On the week, investors fled from junk-bond funds, seeing outflows of $3 billion while outflows from investment grade funds only saw $300 million leave the space compared to $7 billion the previous week. The yield jump on Agency mortgage-backed securities rose 0.48 basis points on average over Treasuries in April as fears that the Fed might begin to sell Agency bonds it owns on its balance sheet which is roughly 40% above median since 2008. There has been an interest in Agency bonds to capture that uptick in yields but yields on Agency mortgage-backed securities, comparatively to Treasuries, has come down since that dramatic rise in April.
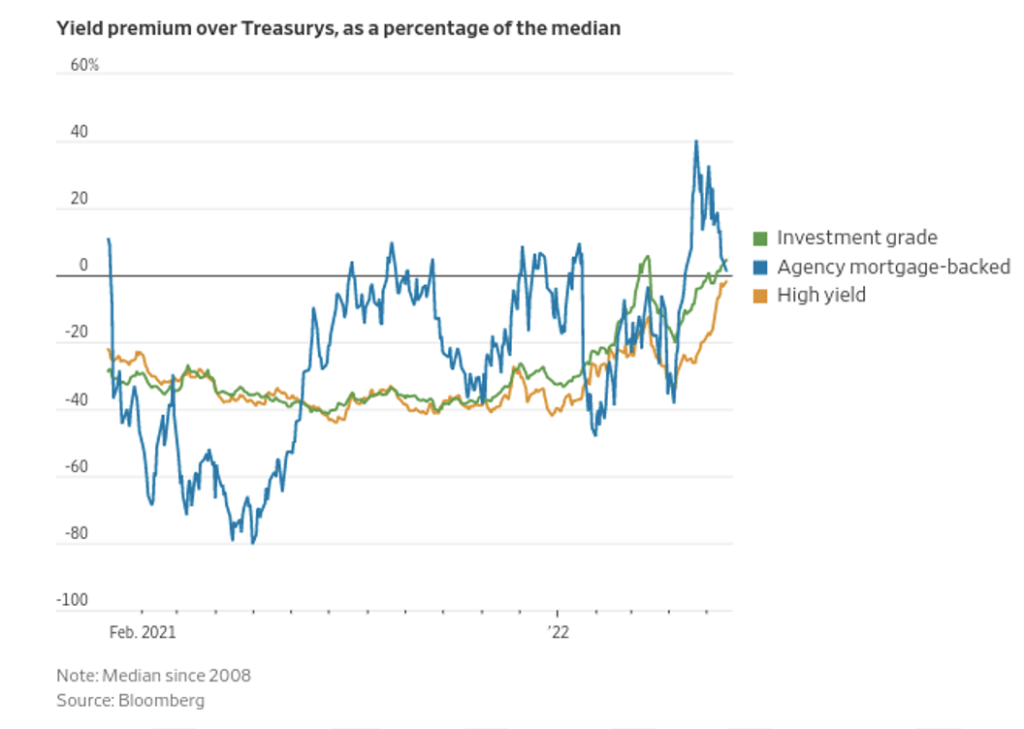
Convertible bonds have been one of the most wounded asset classes among the fixed income spectrum due to their equity characteristics. They have the security of a bond but also can capture some gains from the price of the stock take-off, which has not been the case for most parts of the equity market year to date. Convertible bonds of Wayfair, Upstart Holdings Inc. and Lyft dropped anywhere from 15% to 25% over the past four weeks while Ford’s convertible bonds fell about 13%. Mortgaged-backed bonds with low investment grade credit ratings pay, on average, a spread of 4.2% over Treasuries, 8.4% higher than the median since 2008. 7% on a yield basis, up from 4.9% from the start of the year.
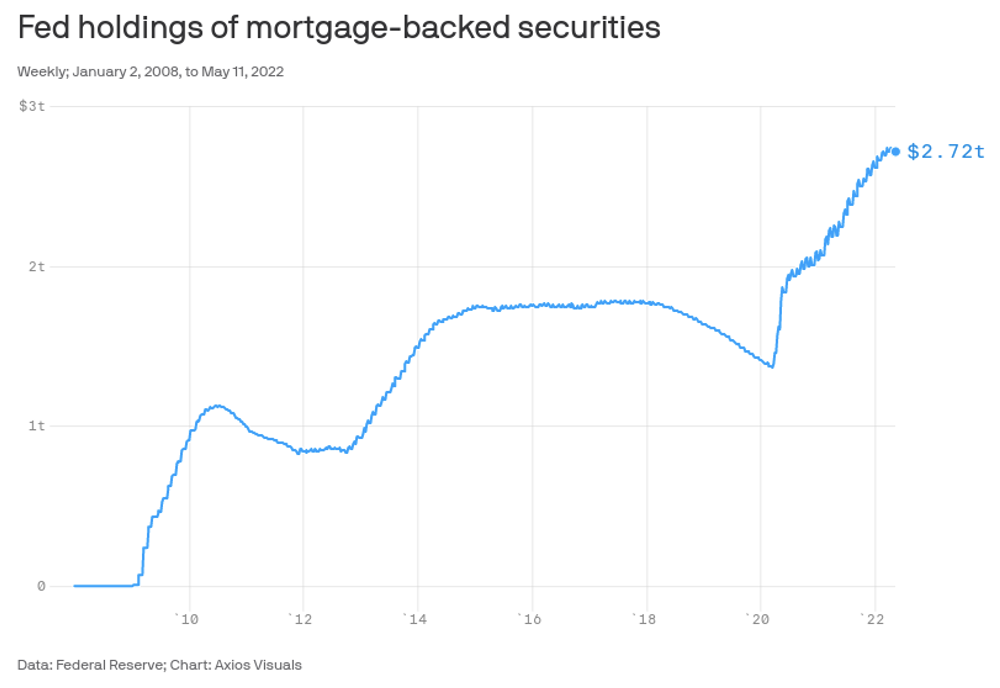
One aspect of the Fed’s plans for monetary tightening is to shrink its mortgage portfolio by up to $35 billion per month by September. That number seems too high when you think of the decrease in refinancing or selling homes due to the high mortgage rates. The 30-year mortgage rate is up 234 basis points compared to last year at this time. Due to people not refinancing or selling their mortgage books is likely to not shrink as dramatically off the Fed’s balance sheet and the Fed will have to deal with having a bigger presence in the housing market than they might want. Actively selling these mortgages-backed securities faces some concerns. If they sell the ones that pay low rates when rates are high, it will absorb losses that will take from the funds the Central Bank returns to the Treasury. Selling will also push mortgage rates higher which would only add strain to the housing industry. We will continue to watch how the Fed handles this issue as well as the other problems it is trying to deal with throughout the near term and into the next meeting in June.
Hedge Funds
Hedge funds were able to reverse trend this past week, posting positive gains compared to a negative MSCI World. The average global hedge fund was up 30 bps compared to -150 bps for the MSCI World. This puts them down 2.2% for month vs. -5% MTD for the MSCI World. Americas based long/short funds were the only group to post negative weekly returns but their -20 bps significantly outperformed the S&P that declined -3% and since the May 9th trough, Americas based long/short funds are +170 bps compared to -220 bps for the S&P.
Crowded names in North America also had positive alpha as longs were down 30 bps and shorts -240 bps. Outside of North America, hedge funds performed quite well with European based funds +80 bps and Asia funds +100 bps. European funds remain the top performers YTD. Hedge fund volumes were lighter this past week compared to the 3 weeks prior with gross exposure remaining constant for long/short funds (selling longs and adding to shorts in close to equal amounts) while multi-strategy, quant and macro funds added to gross exposure. Outside of North America, hedge funds were net sellers in Europe (the first time in 6 weeks) and Japan and but tilted towards buying in Asia ex-Japan.
Data Source: Bloomberg, BBC, Charles Schwab, CNBC, the Daily Shot HFR (returns have a two-day lag), Jim Bianco Research, Market Watch, Morningstar, Pitchbook, Standard & Poor’s, the Wall Street Journal, Morgan Stanley, Goldman Sachs and IR+M