Economic Data Watch and Market Outlook
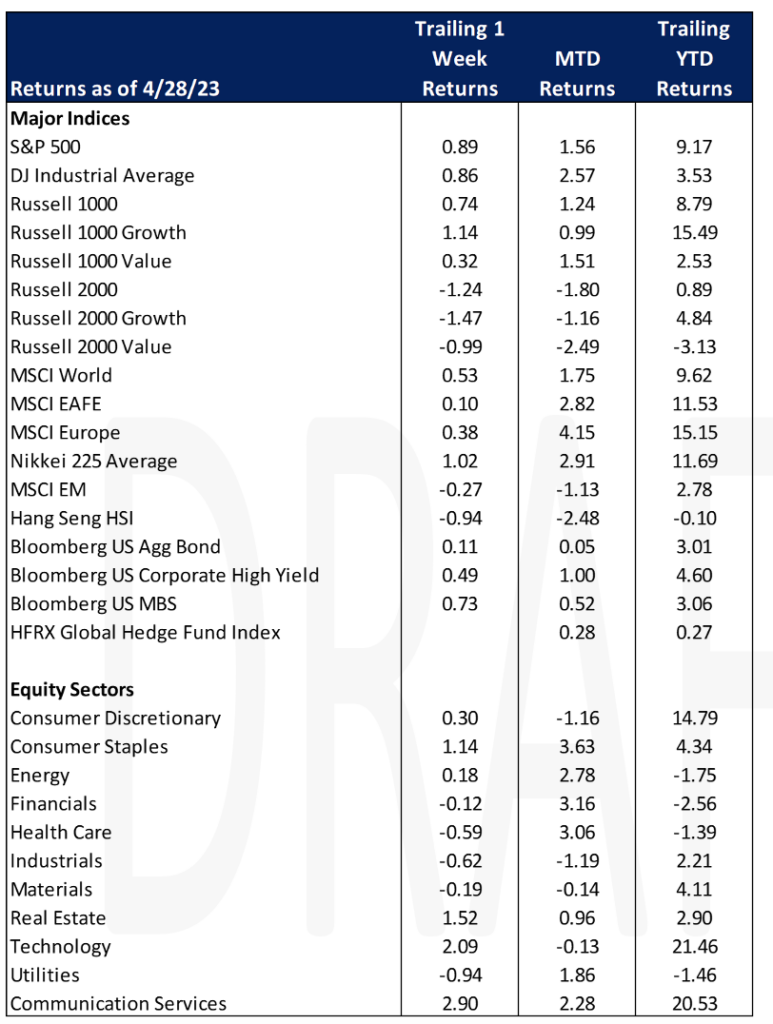
Global stocks rose for the week (MSCI World, 0.53%) with US stocks driving the performance as the S&P 500 was up 0.89%. Growth stocks supported the rally as positive earnings results from larger tech names helped those stocks rally. The US Aggregate Bond Index was up slightly, just 0.11%.
Emerging markets were down slightly for the week (MSCI EM, -0.27%). India’s March infrastructure output grew at a rate of 3.6%, a five-month low. Key detractors included electricity and cement output which government data showed Friday. Output of some sectors was likely dampened by unseasonal rainfall, while other sectors such as coal, fertilizer, and steel showed strong expansion, in excess of 8% for the month.
The Federal Reserve released a post-mortem on Friday of how it handled the SVB crisis noting “Supervisors did not fully appreciate the extent of the vulnerabilities as Silicon Valley Bank grew in size and complexity. When supervisors did identify vulnerabilities, they did not take sufficient steps to ensure that Silicon Valley Bank fixed those problems quickly enough.”
Concerns regarding the banking sector in the US were in the spotlight again as First Republic Bank’s earnings report released on April 24th showed their earnings collapsing. The regulators are pushing for the bank to be sold with bids due on Sunday, April 30th. As of the writing of this piece, the analysts believe PNC will likely be the winner but if they are, they will need to navigate regulators and deposit restriction requirements.
The Core PCE (Personal Consumption Expenditure) Index was released Friday and advanced 4.6% versus the 4.1% estimate. While personal income and expenditures seemed to have increased, tax receipts did not. As the debt ceiling discussion continues to come into focus, the lower than expected receipts will likely put more pressure on resolving the debt limit discussions.
Equities
US equity markets closed slightly higher up for the week (Dow: +0.86%; S&P: +0.89%; Nasdaq: +1.28%) and was higher for the month (Dow: +2.48%; S&P: +1.46%; Nasdaq: +0.04%).
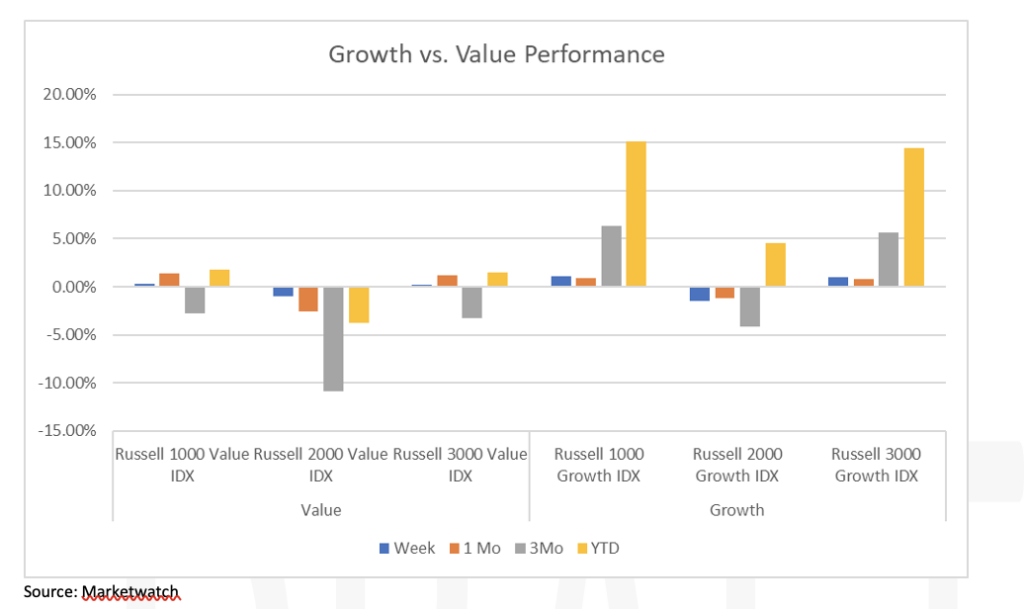
For the week, The Russell 1000 Growth index jumped 1.14% while the Russell 1000 Value rose slightly, 32 basis points. Growth has consistently performed better than value on one month, three month and YTD numbers. Large cap and small cap stocks are performing better than mid-caps over those same time periods but small stocks fell short for the week as the Russell 2000 dropped 1.24%.
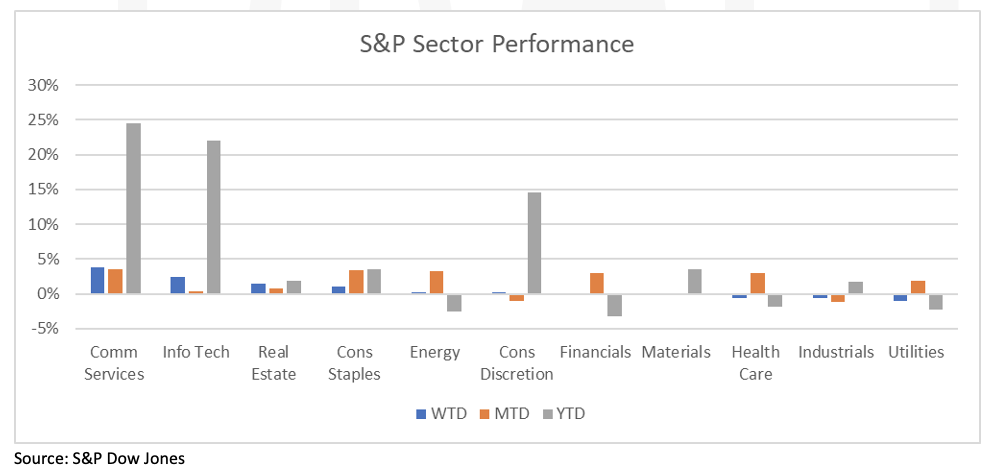
The communication services sector outperformed this week was due to reporting from Meta and Google. Meta Platform (META: +12.88%/week) despite a reported decline in company profit in the first quarter, though less than expected. Mark Zuckerberg, CEO, said that the company was forging development of AI and the metaverse at the same time while simultaneously slowing hiring and flattening the corporate organization. Alphabet Inc (GOOGL: +1.84%/week; GOOG: +2.19%/week) reported quarterly results that slightly topped analysts’ revenue and earnings estimates.
Some other news in the market:
First Republic Bank (FRC:-75.46%/week) dropped -43.30% on Friday as Reuters reported that a seizure by the regulators was imminent. JPM and PNC are bidding to purchase First Republic in a deal as reported by Wall Street Journal. First Republic Bank released first quarter revenue this past Monday that was down 13.4% and net income was down 32.9%. They also reported that they had a 41% drop in deposits during the first quarter.
Exxon Mobile (XOM:+1.97%/week) reported on Friday net income that more than doubled to $11.43B from $5.48B from a year ago first quarter. Adjusted earnings and revenue were above consensus. Exxon’s oil and gas net production increased by nearly 300,000 oil-equivalent barrels per day though exploration and production fell 10% and natural gas realizations dropped by 23%.
Amazon’s (AMZN: -1.40%/week) stock was initially higher but fell for the week after revenues topped estimates but the CFO warned of slowing growth in AWS cloud services. Amazon saw a 16% growth in its AWS business during the March quarter while Microsoft had reported a 27% growth.
Overall global markets are higher year to date with the largest gainers being the Nasdaq (+16.82%), DAX (14.36%) and Nikkei (10.58%).
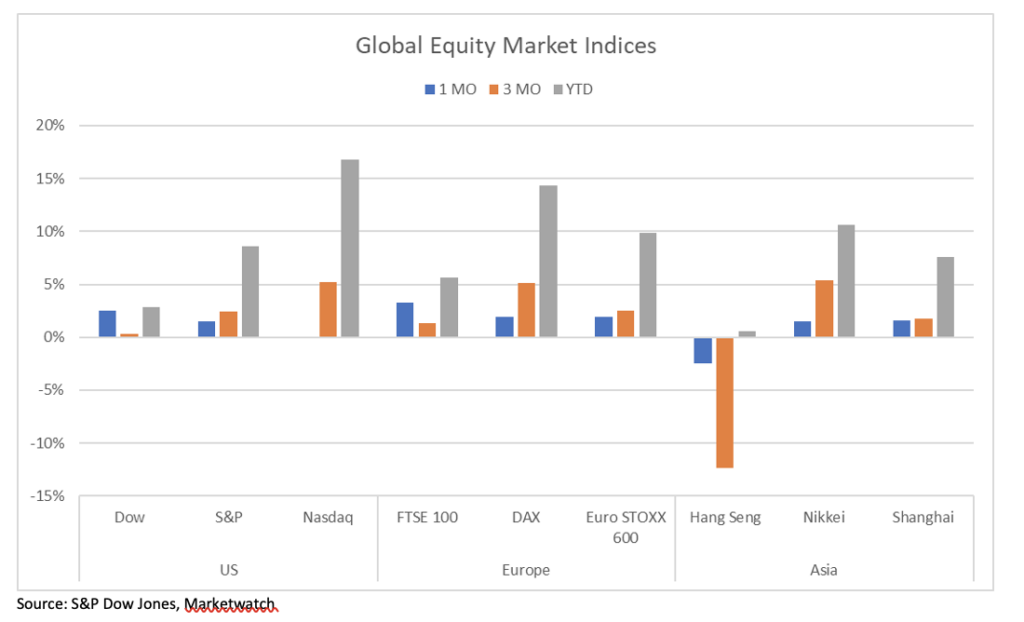
European equity markets were mixed for the week (FTSE 100: -0.63%; DAX: +0.15%; Euro STOXX 600: -0.50%) but gained on the month (FTSE 100: +3.28%; DAX: +0.15%; Euro STOXX 600: +2.59%). LVMH’s (MC: -3.53%/week) market capitalization reached $500B on Monday, the first European company to reach that landmark.
Asian equity markets were mixed for the week (Hang Seng: -0.63%; Nikkei: +1.02%; Shanghai: +0.67%) and mixed for the month (Hang Seng: -2.48%; Nikkei: +1.48%; Shanghai: +1.54%).
Fixed Income
Treasury Yields fell across the board during the last week of April as investors parsed through important economic data that could impact the Federal Reserve’s next move. Thursday’s report showed that GDP rose 1.1% at an annualized rate which in turn caused the 2-year Treasury yield to jump over 15 bps the same day. Ultimately, yields finished the week lower with the 2-year Treasury yield falling 13 bps, the 10-year Treasury yield falling 13 bps, and the 30-year Treasury yield falling 11 bps. Indices posted positive returns with the Bloomberg US Aggregate Bond Index rising 0.11%, the Bloomberg US Corporate High Yield Index rising 0.49%, and the Bloomberg US MBS Index rising 0.73%. The Fed is set to meet in the first week of May and investors expect an interest rate hike of 25 bps.
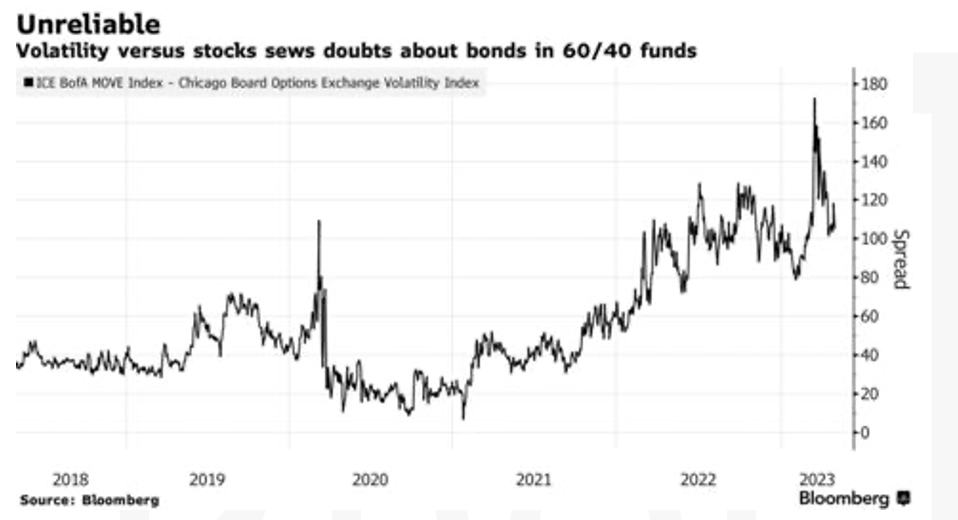
The largest swings in bonds in over a decade took place in the first several months of the year, which has brought the typical 60/40 portfolio into question by major banks such as BlackRock and Goldman Sachs. Last year a model 60/40 portfolio of stocks and bonds fell 17%, the worst performance since 2008. Bond markets have calmed considerably since the wild swings we saw in March, spurred on by the collapse of several regional banks, but investors are looking for better options in a rising rate environment, coupled with the possibility of a recession.
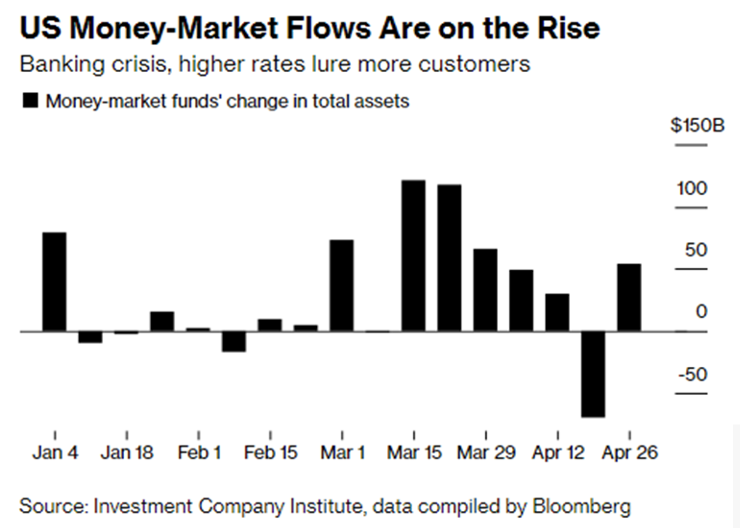
Money-market funds are continuing to gain popularity, with the current value of all money-market funds sitting at $5.3T, an $800B increase from a year ago according to the Investment Company Institute. Money-market funds have seen net inflows of $369B since mid-March, and funds have stopped having to discount fees to retain business. The largest beneficiaries of this new trend are Fidelity, BlackRock, Federated Hermes, and the asset-management groups of Goldman Sachs and JPMorgan. BlackRock saw $40B of net inflows into cash-management assets during the month of March, with Larry Fink stating that they expect the shift from deposits to money markets to be a longer-term trend.
Hedge Funds as of Thursday, April 27th
The last week of April was challenging across all geographies except Europe. The average global fund posted losses of 33 bps vs. -26 bps for the MSCI World while the average Americas-based long/short equity fund was more challenged, failing to capture a meaningful portion of Thursdays’ equity market rally, declining 72 bps for the week with the S&P 500 flattish. April was looking to be a good month for US long/short equity funds as they were steadily capturing ~ 65% of the S&P upside but finished the month flat vs. +72 bps for the index. In Asia, the average fund was down 70 bps, the average long/short equity fund down ~1% for the week compared to the MSCI Asia Pacific -70 bps for the same time frame. The only bright spot was Europe where EU-based funds were roughly flat vs. -76 bps for the Euro STOXX 600. HF were sellers of global regions with the selling taking place across regions. In NA, volumes picked up this past week where they had been on the lighter side for most of the month. The net selling came from more short adds than long adds with most of the short selling in index level products and the long adds in single-name. Regarding single-name, the long adds were mostly in TMT and any single-name selling was heavily weighted towards industrials which is a reversal from the past few weeks. In the EU, HF bought defensive sectors (RE, utilities, healthcare) and sold cyclicals (energy, consumer discretionary, materials). HF were sellers of AxJ as they sold longs and added shorts mostly in Taiwan, Australia and China (H-shares). Lastly, HF de-grossed in Japan covering shorts in communications services and selling longs more broadly across sectors.
Outside of equities, the aggregate US single-name corporate bond long/short ratio fell for the 4th straight week as HF reduced net length in IG credit. It was the largest weekly decrease since November 2022.
Private Equity
Rising valuations in 2021 coupled with a drop in public market assets in 2022 have caused many institutional investors to be over allocated to private markets. This poses a strong opportunity for secondary investors if allocators are drawn into a liquidity crunch or surpass target allocations for their private assets. Some allocators have also pulled back on forward commitments or explored emerging managers that might have posed a strong opportunity if they weren’t already over allocated to private assets. Historically this has hurt many investors since a pause or pull back tends to invest in vintage years with lesser returns since vintage years during market downtrends tend to outperform the years following. Per data from Jefferies, 48% of institutional investors selling in the first half of 2021 were first time sellers. In 2022 LP’s were only able to sell at 81% of NAV which is a significant decline from 92% in 2021.
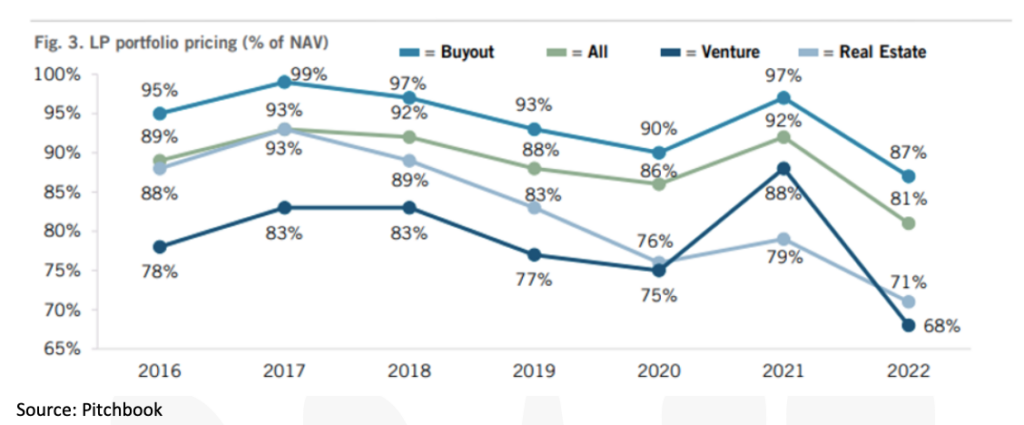
2022 saw a great pricing reversal on the secondary market for LP portfolios declining 1,100 basis points to 81% of NAV across all different strategies. The declines came from perceived inflated private company valuations, expected delays in portfolio company exits, higher underwriting hurdles due to recession fears and increased buyer selectivity. Tighter lending underwriting standards in 2022 and interest rate hikes reduced buyers’ use of leverage. 2023 is expected to see a rebound for both LP and GP led transactions. Many LPs are experiencing negative cash flows in their private equity programs due to capital calls outpacing distribution activity which will lead to a stronger demand for liquidity bringing deals to the secondary market. Many LPs over allocated to PE ending 2022 will most likely wait until pressure builds which usually take 2-4 quarters when they are usually forced to come to market. Buyers will likely remain selective in the near term but expected to have enough capital to deploy to match the pent-up supply expected from sellers coming to market in 2023.
Data Source: Apollo, Bloomberg, BBC, Charles Schwab, CNBC, the Daily Shot HFR (returns have a two-day lag), Goldman Sachs, Jim Bianco Research, Market Watch, Morningstar, Morgan Stanley. Pitchbook, Standard & Poor’s and the Wall Street Journal.