
Economic Data Watch and Market Outlook
Equity markets globally declined 2.78% as indicated by the MSCI World as Putin maintained his resolve to invade Ukraine. What Russia expected to be a quick takeover has proven to be extremely difficult. NATO countries have rallied and sharpened their resolve as well. The US and EU are currently considering banning all purchases of Russian oil further strangling Russia economically. Meanwhile, gas prices risen significantly. Within the US, gas prices rose roughly 11% during the last seven days as reported by AAA. The national average as of this writing is $4.009 per gallon. The US imports roughly 1.3% of global crude supply from Russia in 2020 which increased to about 3.3% in 2021. Russia produces about 10% of global supply.
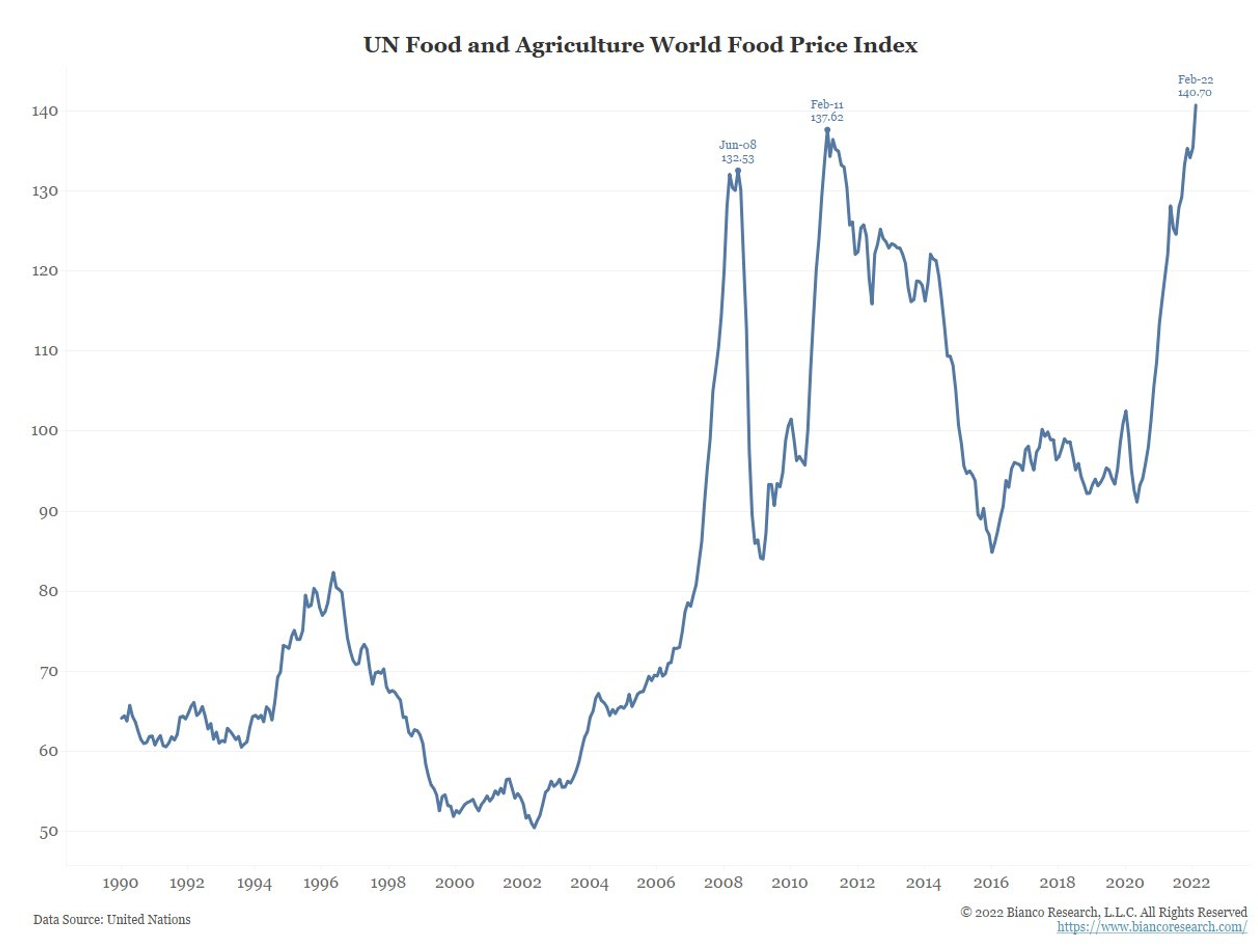
Most of the attention has been placed on oil production and gas prices but Russia and Ukraine also produce a significant amount of grain. They also produce one of the most common fertilizers, potash. Canada is the single largest producer, but Russia and Belarus are also significant producers. In February, Belarus, announced that it would not be able to honor its contracts as a result of sanctions. Soft red Winter wheat futures rose to a 14 year high on February 27 at $13.345 and closed Friday at $13.40. The conflict will likely disrupt spring planting in Ukraine, responsible for 20% of global grain production, and Russia’s yield will be reduced and supplies will be minimal in global markets. This presents a significant problem as prices according to the UN were already at a high when the war started.
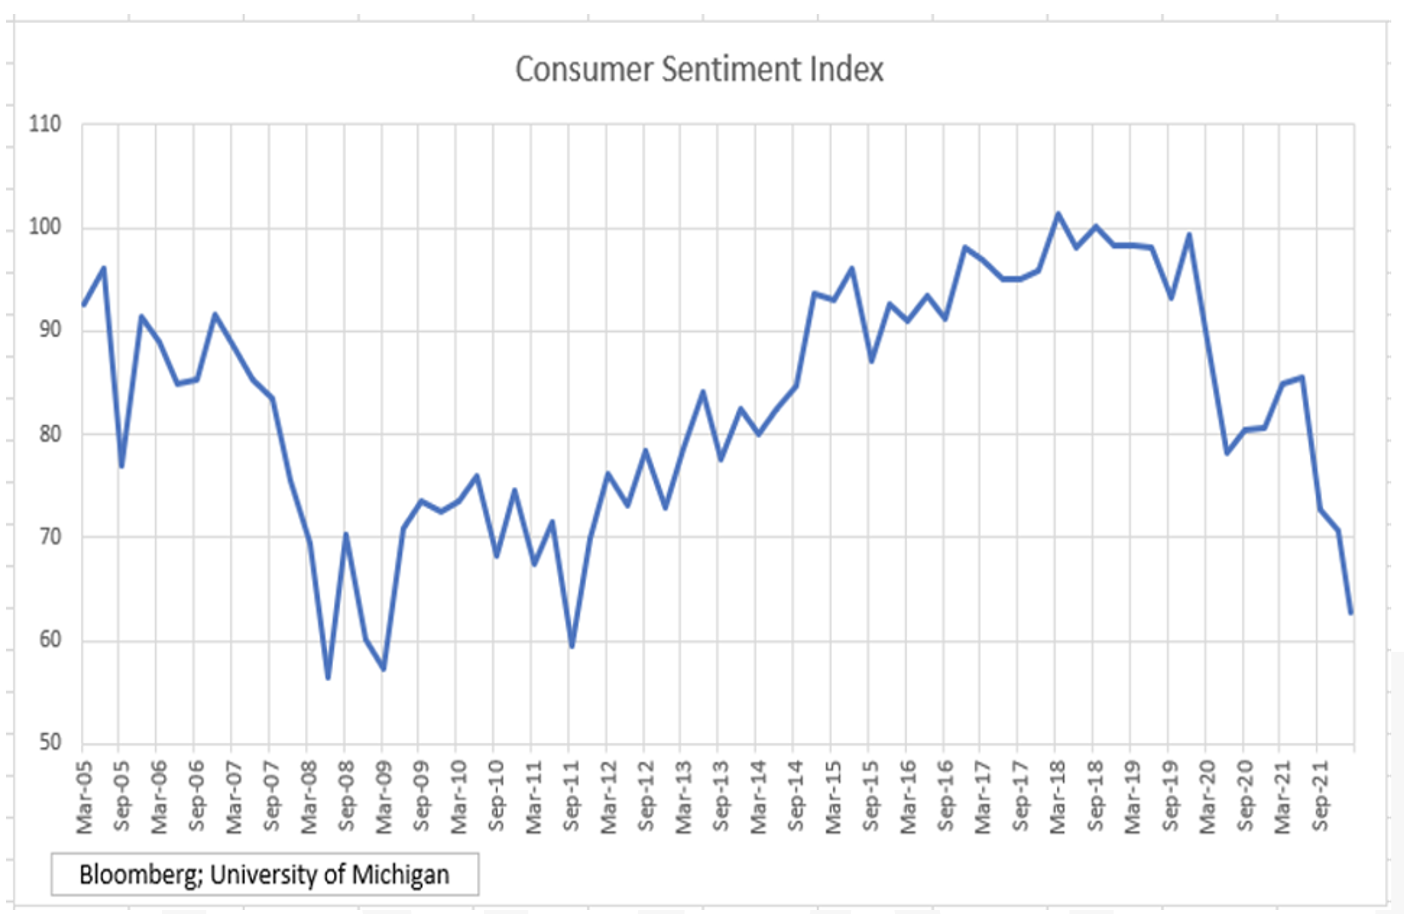
US Employment data released on Friday was better than expected (678k vs consensus estimate of 423k) with the unemployment rate dipping to 3.8% for February. Chairman Jerome Powell noted in a recent Senate Banking testimony when pressed by Senator Shelby about Volcker’s tactics in the 80’s of pushing the economy into recession to get a handle on price stability, Powell’s response was a quick and certain “yes”. Higher prices may already do that. We are seeing early signs that despite strong employment, sentiment is waning.
Export/Import data, various commodities, and CPI data will be released this week. The Small business sentiment will also be a telling data point.
Equities
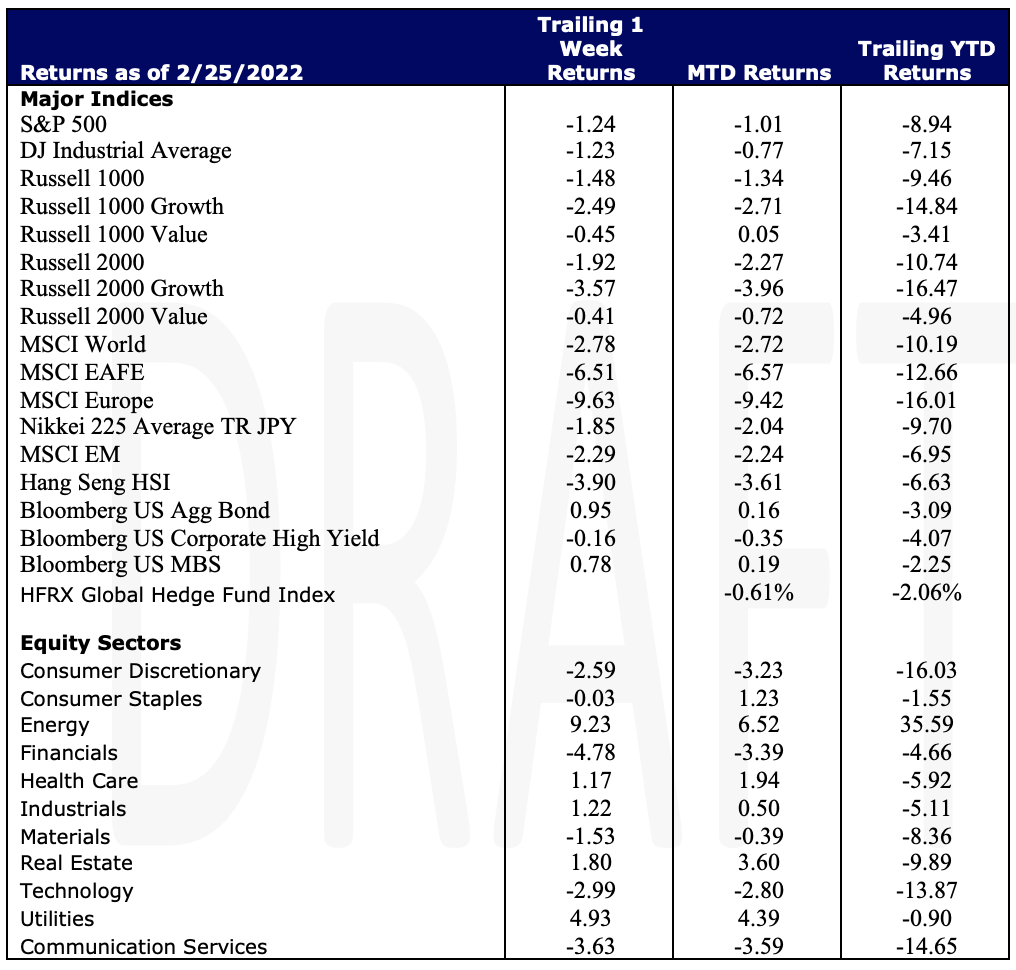
The S&P 500 closed down -1.24% on the week as investors continued to weigh negative economic effects from Russia’s war in Ukraine. The Dow suffered its 4th consecutive week of losses down -1.23% extending losses on the year of -7.15% thus far. The tensions in the Ukraine outweighed the strong jobs data released this week – reaffirming investors of the US economic recovery. Financials (-4.78%), Communication Services (-3.63%), and Technology (-2.99%) were the biggest detractors of the 11 S&P sectors while Energy (+9.23%) and Utilities (+4.93%) posted strong gains on the week. Small-cap growth stocks in the Russell 2000 Growth Index extended losses posting a weekly loss of -3.57%, extending YTD losses to 16.47%. Small-cap Value stocks in the Russell 2000 Value posted a -0.41% loss on the week also extending losses on the year of -4.96%.
Globally, Europe stocks sank into correction territory posting a loss of -9.63% on the week. YTD, Europe is down -16.01%. The MSCI World was down -2.78% and Emerging Markets down -2.29%.
Fixed Income
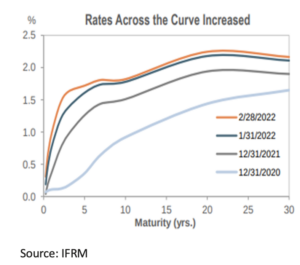
Fed Chairman Jerome Powell testified in front of Congress this week and voiced a strong inclination towards a 25-basis point rate hike at the upcoming March FOMC Meeting. Jerome Powell compared it to walking in a dark room and trying to avoid tripping over furniture. Future aggressive rate hikes later this year will be a real possibility if inflation persists with the War in Europe being a main contributor to the already complex inflationary pressures. Treasuries saw their most volatile week since 2008 as fighting in Ukraine escalated. The 2-year treasury note dropped as low as 1.257% on Tuesday and closed the week at 1.49%. The 10-year treasury note finished the week at 1.73% which was its worst week since March 2020. The 30-year treasury bond lost 11.6 basis points this week to close at 2.16%. This marks the 6th consecutive week of outflows of municipal bond mutual funds and ETFs reaching $2 billion for the week. The asset backed security market has seen $46.5 billion in new issuances, behind last year’s pace by $2.5 billion, though recent fillings indicate multiple new deals to hit the market soon. High yield issuance picked up this week following a 2-week hiatus with two new issuers bringing $1.7 billion in supply. Investment grade corporate spreads continue to widen as new issuance came to life pricing almost $54 billion this week. February saw the Bloomberg Aggregate Index fall around 1% compared to January’s 2% decline. Expect markets to be volatile as the Russian invasion continues to escalate.
Hedge Funds
It was a challenging start to the month for hedge funds as most funds posted losses in excess of their respective benchmarks.A mericas based long/short equity funds posted their worst returns compared to the benchmark as crowded longs in North America fell 3.3% compared to 50 bps for the S&P 500, representing the worst spread in 5+ years. Global long/short funds are still significantly outperforming the MSCI World (less than half the loss) and US funds are still outperforming the S&P YTD, but the first week of March has significantly closed the gap. In other regions, Europe was the only region where funds outpaced their respective benchmark. For the week, Asia based funds underperformed the MSCI Asia Pacific index but are still ahead YTD.
Flows for the week were fairly muted in the US until Thursday when sentiment turned bearish leading to Thursday being one of the largest net selling days YTD. The selling was in single names in the sectors with the largest gross exposures getting the brunt of the activity (technology, communications services, healthcare, industrials and consumer discretionary). The selling was driven by both long reductions and short additions. Where there was buying, hedge funds sold ETFs and redeployed the capital into sectors with lighter gross exposure (energy, utilities, real estate and financials). Net exposure in commodity sensitive stocks rose with the continued escalation of geopolitical risk. Outside of North America, the selling was consistent for the week in Europe and AxJ predominantly from short additions.
Private Equity
Mega-deals, defined as transactions of $1 billion or above, shattered both annual number and aggregate value records in 2021 accounting for 32% of all US PE activity. Driven by low interest rates, record levels of dry powder, and increasing fund sizes firm’s abilities to pursue and secure mega-deals greatly increased. In 2021, the average size of a mega-deal was $3.1 billion, surpassing the $3 billion mark for the first time in five years.
Subsequently, mega-exit activity was also the strongest it has ever been benefiting from robust exit opportunities and elevated multiples across sectors. Mega-exits skyrocketed compared to 2021 with exit counts increasing by 149.2% and exit value increasing by 129.1%. Public listings dominated mega-exits with 75 PE-backed companies listing valuations about $1 billion; a record far beyond previous annual numbers.
Several factors could impact the steadfast growth of the mega-deal and mega-exits including the expected rise in interest rates to curb inflation and the Biden administration’s increased focus on antirust legislation. Although the anticipation of higher rates has already prompted some market volatility and antitrust legislation has blocked some deals, analyst predict this will not significantly reduce mega-deal activity if growth remains the same.
Data Source: AGWEB Farm Journal, Bloomberg, CDC, CNBC, the Daily Shot HFR (returns have a two-day lag), Financial Times, Fund Fire, Morningstar, Pitchbook, Standard & Poor’s, US Census Bureau, the Wall Street Journal, Morgan Stanley and Goldman Sachs Capital Introduction and IR+M
| This report discusses general market activity, industry, or sector trends, or other broad-based economic, market or political conditions and should not be construed as research or investment advice. It is for informational purposes only and does not constitute, and is not to be construed as, an offer or solicitation to buy or sell any securities or related financial instruments. Opinions expressed in this report reflect current opinions of Clearbrook as of the date appearing in this material only. This report is based on information obtained from sources believed to be reliable, but no independent verification has been made and Clearbrook does not guarantee its accuracy or completeness. Clearbrook does not make any representations in this material regarding the suitability of any security for a particular investor or the tax-exempt nature or taxability of payments made in respect to any security. Investors are urged to consult with their financial advisors before buying or selling any securities. The information in this report may not be current and Clearbrook has no obligation to provide any updates or changes. |