Economic Data Watch and Market Outlook
Manufacturing Purchasing Managers’ Index (PMI) measures the activity level of purchasing managers in the manufacturing sector. A reading above 50 indicates expansion in the sector; below 50 indicates contraction. PMI index was reported on Wednesday, March 1st and came in at 47.3 slightly, below consensus of 47.8. This compares to the previous month’s reading that came in at 46.9. Later in the week non-manufacturing PMI was released and exceeded expectations, 55.1 versus 54.5. This result caused the Dow to rally 387 points and the S&P 500 to jump 64 points.
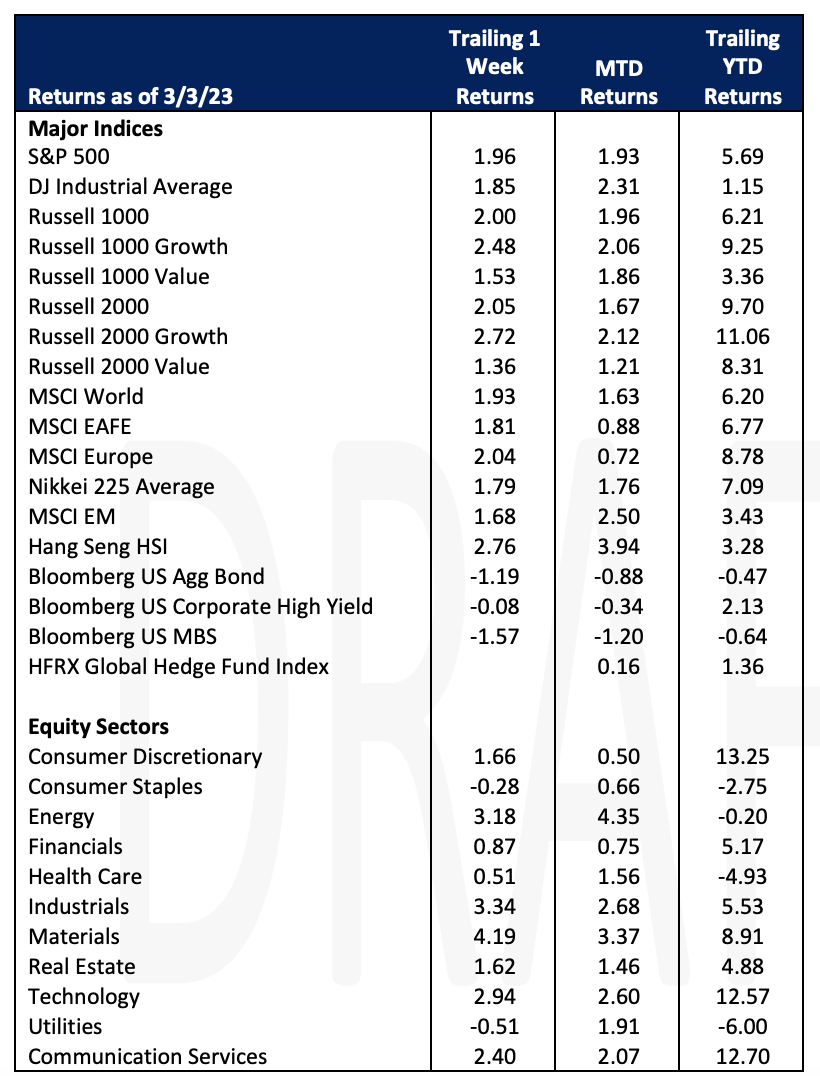
The S&P 500 rallied 1.96% for the week despite comments earlier in the week from Fed Governor Waller that hotter data will likely create a need for higher rates. The topic of disinflation that circulated last month seems to have dissipated as the Fed debates the need for about a 25 basis point or 50 basis point hike. Global stocks rose 1.93% reacting to similar manufacturing data. Bonds, however, sank (Bloomberg Aggregate Bond index, -1.19%) as the discussion increased around future rate increases.
On Friday, Amazon announced that it is pausing construction on is new complex in Arlington, VA known as HQ2. Investors may recall that in 2018 Amazon had a much-publicized search looking at 238 municipal proposals for its new location. Initially it had selected New York City after receiving $3 billion in tax breaks but later that year scrapped those plans and selected the Virginia location.
Profits in the tech sector declined 8.4% year over year. According to the Wall Street Journal, this is the worst decline since 2009 but the decline has not spilled over into other sectors. And while earnings have trailed off and well publicized layoffs have been announced, employment in the sector remains mostly unchanged but this is highlighted against a backdrop of full employment and other industries that continue to grow.
Corporate stock buybacks are bolstering the market in 2023, with repurchases of S&P 500 companies expected to top $1T this year. The largest buybacks announced this year so far include Chevron, META, and Goldman Sachs. In Q4 of 2022, large tech companies where the primary driver of buybacks, with Apple spending roughly $19.5B, and META spending $6.9B.
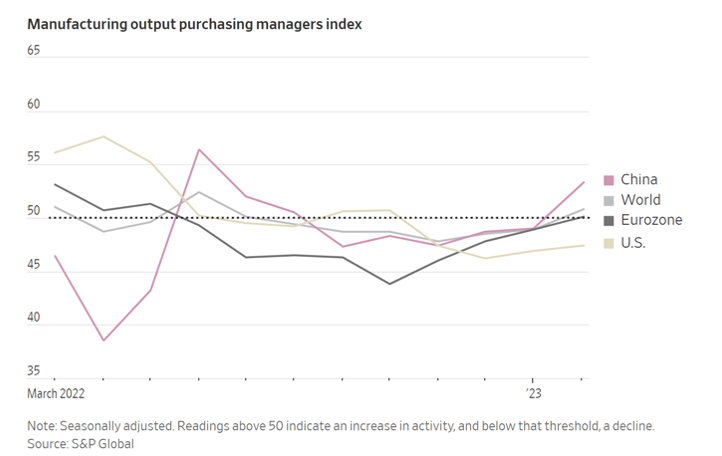
German import data came in considerably below consensus ( -3.4% versus 2.0%) but exports came in above (2.1% versus 1.5%). German PMI and French PMI came in mixed but both above 50. Manufacturing continues to expand as most economies continue to be in expansionary mode which will continue the discussion among central banks around rate increases.
Equities
Equity markets rallied Friday (Dow: -+1.17%; S&P: +1.61%; Nasdaq: +1.97%) up for the week (Dow: +1.8%; S&P: +1.9%; Nasdaq: +2.6%) after the ISM services index held steady in February, demonstrating the US economy is still in expansion mode. Some stock market movers on Friday included: C3.ai (AI: +33.60%), an artificial intelligence software company that posted better than expected fiscal third quarter results; Samsara (IOT: +15.40%), a physical asset tracking company and First Solar (FSLR: +6.00%), a maker of solar panels.
Equity markets seem to be favoring growth again as the NASDAQ has risen +12.56%. This compares to the Dow (+1.15%) and S&P (+5.69%) which are up substantially less than their growth dominated brethren. Not surprisingly growth indices have outperformed value indices as demonstrated by the Russell 1000 Growth (+9.25%) and the Russell 1000 Value (+3.36%).
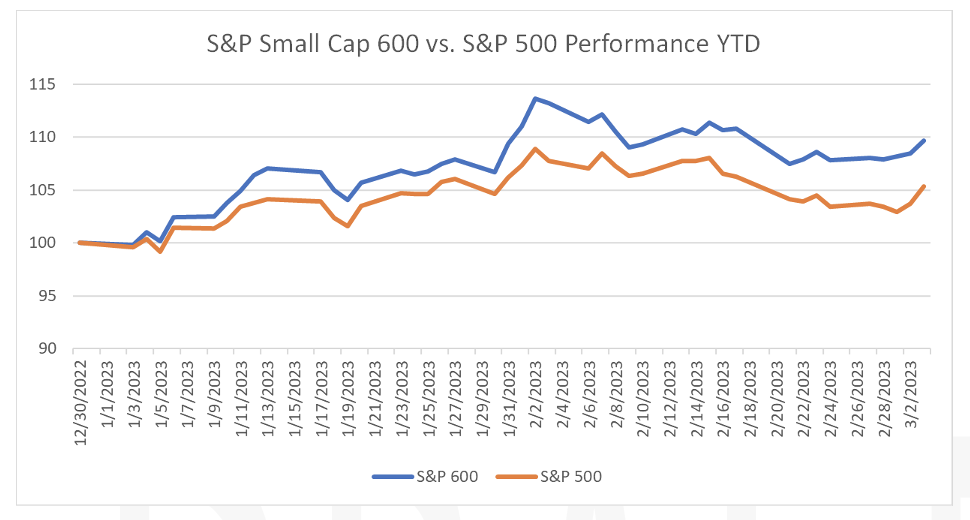
Despite recession fears, investors are betting on small-cap domestic stocks to outperform even as the broader market struggles. US mutual and exchange traded funds that purchase small cap stocks have seen inflows of $4.2B since the start of 2023, while large-cap funds have seen outflows of $17.4B.
Cryptocurrency firm Silvergate Capital Corp. fell this week (SI: -59.74%) as it disclosed on Wednesday that it was at risk of being “less than well capitalized” and was evaluating its ability to continue doing business. The industry has continued to experience volatility as speculation continues to grow over regulation by Congress and the SEC.
Taiwan Semiconductor (TSM: +0.85%) announced Friday that it expects to recruit more than 6,000 new staff in 2023 as reported by Reuters.
European equity markets (FTSE 100: +0.92%; DAX: +2.47%; Euro STOXX 600: 1.43%) and Asian equity markets (Hang Seng: +2.76%; Nikkei: +1.79%; Shanghai +1.87%) were up for the week.
Fixed Income
Persistent inflation metrics and fears of higher interest rates pushed the 10-year Treasury yield above 4.00% on Wednesday for the first time since early November. The two -year Treasury yield raced higher as well, closing at 4.89%. On Friday, bonds faced volatility but ultimately yields fell on the day. Yields were mixed for the week, with the 2-year Treasury yield rising 8 bps, the 10-year Treasury yield rising 2 bps, and the 30-year yield falling 3 bps. The Bloomberg US Aggregate Bond Index fell -1.19% for the week. A month ago, futures markets priced in an 83% chance of the Fed raising rates by 25 bps, and a 0% chance of a 50 bps hike at the upcoming March meeting placing the Fed Funds target rate between 4.50% and 4.75%. Since then, the odds have shifted with the CME FedWatch Tool now showing the market sees a 69.4% chance of hiking 25 bps, and a 30.6% chance of a 50 bps hike in March.
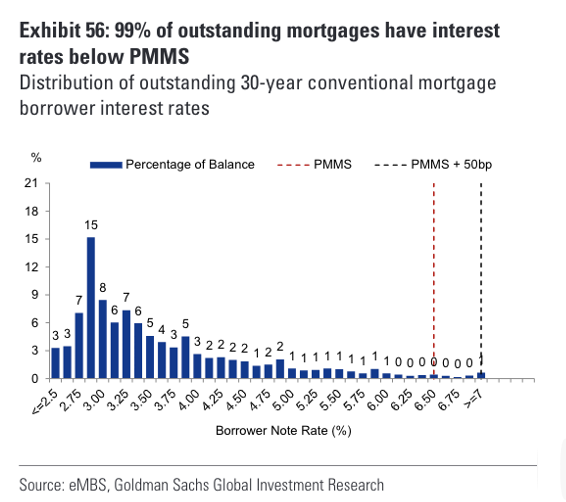
30-year fixed rate mortgages hit 7.10% on Thursday, the highest reading since November 2022 where mortgage rates peaked at 7.37%. According to Goldman Sachs, 99% of borrowers have a mortgage rate lower than 6% or the current market rate. 28% have a rate lower than 3%. In turn, homeowners are incentivized to hold on to their assets even if they could turn a profit on a sale. Currently the monthly principal and interest payment on a home purchased with a 7% mortgage rate on a $600,000 dollar home would be $3,992 per month. The same purchase with a 3% mortgage rate would be $2,530 per month.
Hedge Funds
For the month of February, the average global fund ended down 95 bps capturing ~30% of the downside of the MSCI World, vs. the average global long/short equity fund capturing 60% of the downside losing 1.83%. The average US-based L/S fund performed relatively in line with global funds capturing ~50% of the downside of the S&P, ending February down 1.3%. Performance was most challenging in Europe where the average EU-based long/short equity fund ended the month down 95 bps while the Euro STOXX 600 returned close to 2%. Performance was most challenging in Asia for the month as the MSCI Asia lost close to 6%, though Asia-based L/S funds slightly outperformed losing only 3.7%, experiencing ~60% of the downside. However, the first two days of March were off to a far better start for all regions based on prime brokerage initial estimates. The average global long/short equity fund gained ~70 bps (vs. MSCI + 38 bps), the average US L/S fund gained ~46 bps (vs. S&P 500 +30bps), EU L/S gained ~50 bps (vs. STOXX 600 -17 bps) and Asia L/S gained 1.6% (vs. MSCI Asia +99 bps). The top 50 crowded shorts in NA continued to be challenging as the long/short spread ended the week -24 bps, though across the first two days of March the L/S spread was positive ~50 bps as HFs generated positive alpha on both sides of the book. In Europe and Asia, crowded longs were strong last week, while EU’s top 50 crowded shorts were in line with the benchmark, and Asia’s crowded shorts outperformed (though Asia L/S spread was positive last week). HFs were buyers of global equities as they added to longs on a net basis, with a smaller portion offset by short additions. All regions were bought on a net basis, led by AxJ accounting for much of the global flow this week, followed by NA and EU that were more muted as HFs added on both sides of the book. Starting with NA, consumer discretionary, RE, healthcare, and TMT-related names were bought, led by interactive media (most net bought industry across all sectors), healthcare providers and services (long adds), multiline retail (short covers) and pharma (long adds). Notably, March 1st and 2nd saw the largest amount of buying in multiline retail YTD. Financials, industrials and materials were net sold led by capital markets, banks, metals & mining and machinery. Outside the US, in Europe, HFs sold EU cyclicals after being net buyers of the group every week YTD. HFs sold EU industrials, materials, utilities and financials as they added shorts in capital markets, independent power & renewables and semiconductors, while selling longs in commercial services. In AxJ, HFs were large buyers of TMT-related names, industrials and utilities. This marked the 9th consecutive week where HFs were buyers of the region through long adds. In Japan, HFs were buyers of cyclical sectors but sellers of most defensive sectors (except for consumer staples where they were smaller buyers). Fundamental long/short equity managers are increasingly positioned for idiosyncratic risk having sharply reducing beta exposure.
Private Equity
Citizens M&A Outlook report for 2023 conveys a sense of optimism for M&A in the coming year among middle-market and private equity firms alike. After the record highs of 2021 and the geopolitical disruptions of 2022, Citizens believes 2023 holds optimistic expectations for company performance and high demand for growth.
Although different across sectors, the report sites valuation and company performances remain overall positive with more than 80% of respondents believing that company valuations will be equal to or higher than in 2022. Of 8 sector valuations assessed, the Business Services sector showed the most bullish expectations with an expected increase in valuation of 48% followed closely behind by the Technology, Media & Telecom sector with 37% expected increase in valuations. The only sector in which majority of participants expected lower valuations was the Transportation and Logistic sector at -21%.
Despite inflation and other economic headwinds many middle-market companies are optimistic about their performance in the coming year with nearly two-thirds of companies polled citing M&A as their primary growth driver. Of those polled, 62% cited the top reason for making an acquisition in the coming year would be to increase revenue and growth, followed by to improvements to operational efficiency at 39%. Though valuations have retreated from 2021 peaks, middle-market companies and PE firms alike seem to agree that the market still slightly favors sellers. About a third of those surveyed anticipate increased deal flow citing improving economic conditions and lower interest rates.
Data Source: Bloomberg, BBC, Charles Schwab, CNBC, the Daily Shot HFR (returns have a two-day lag), Jim Bianco Research, Market Watch, Morningstar, Pitchbook, Standard & Poor’s, Morgan Stanley, Goldman Sachs, Citizens M&A Outlook and the Wall Street Journal.