
Economic Data Watch and Market Outlook
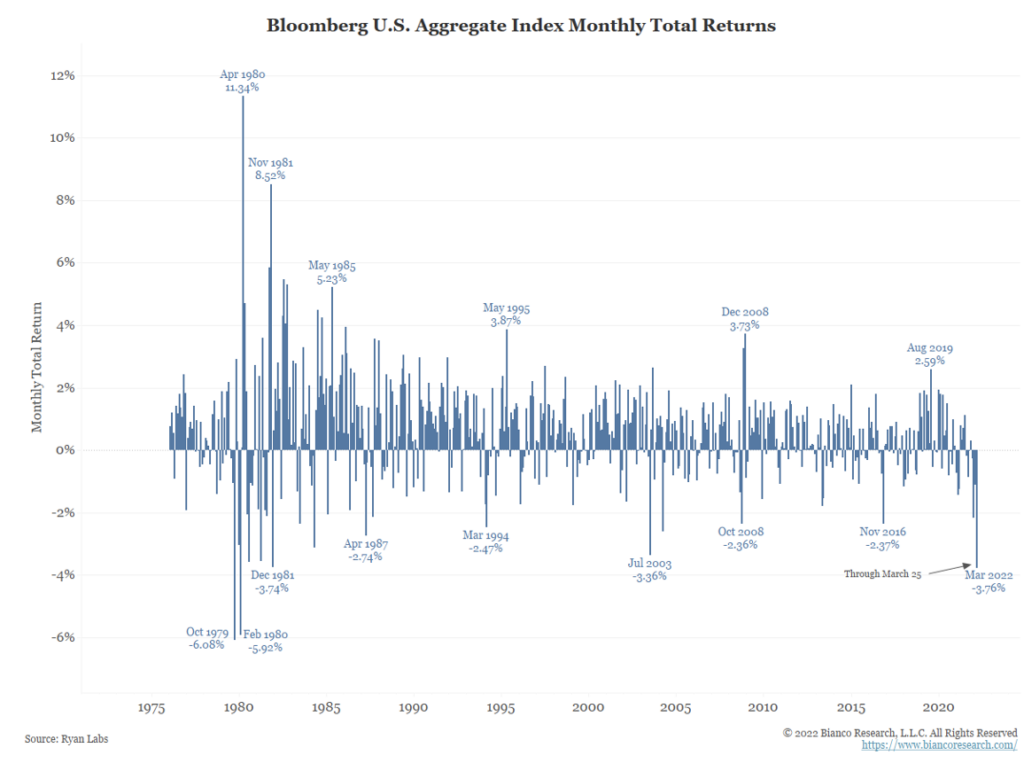
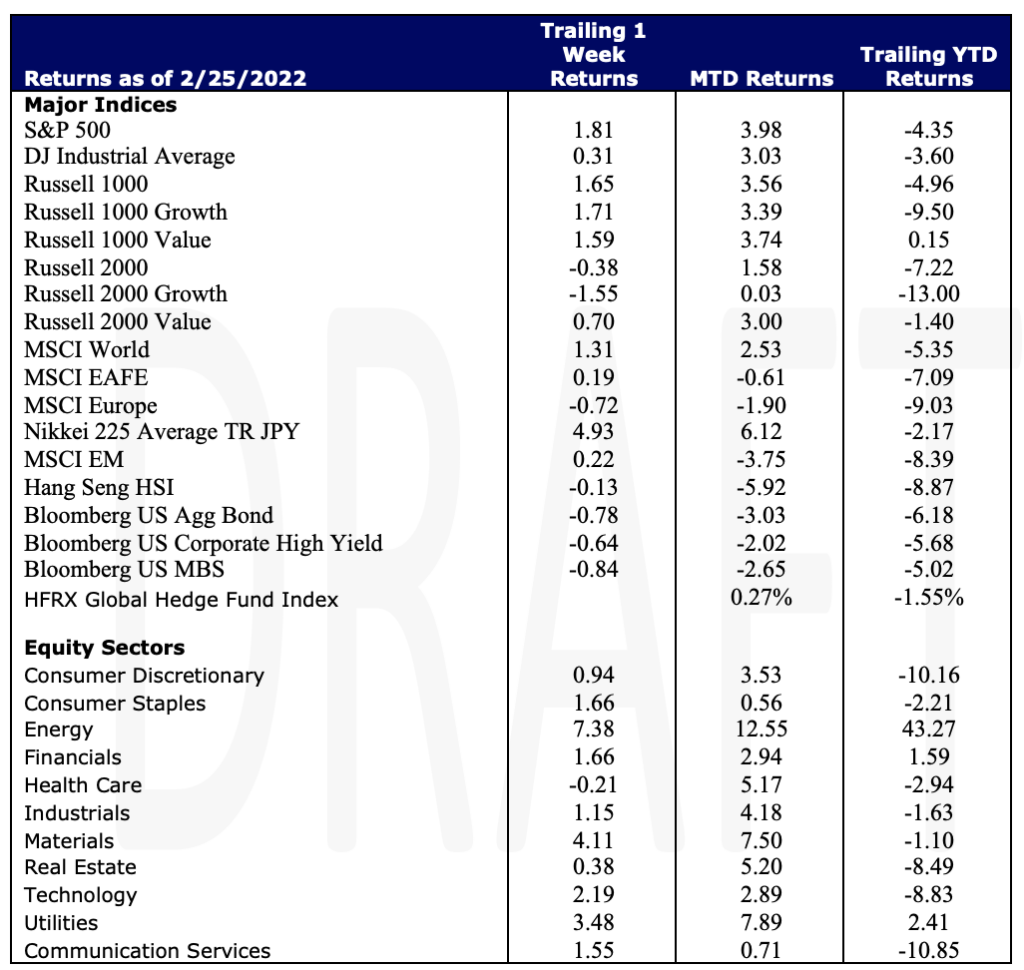
Global equities rose 1.31% for the week while the US Aggregate Bond index fell 78 basis points. Bonds are down 3.03% MTD and down 6.18% YTD. If the month ended Friday, the monthly return would be the worst in 42 years.
The Fed Funds rate increased and the markets are back to reading the tea leaves, debating how many more rate increases will take place this year and by how much. Inflation is, indeed, worrisome and part of the debate continues to be if the Fed is willing to risk sending the US economy into a recession.
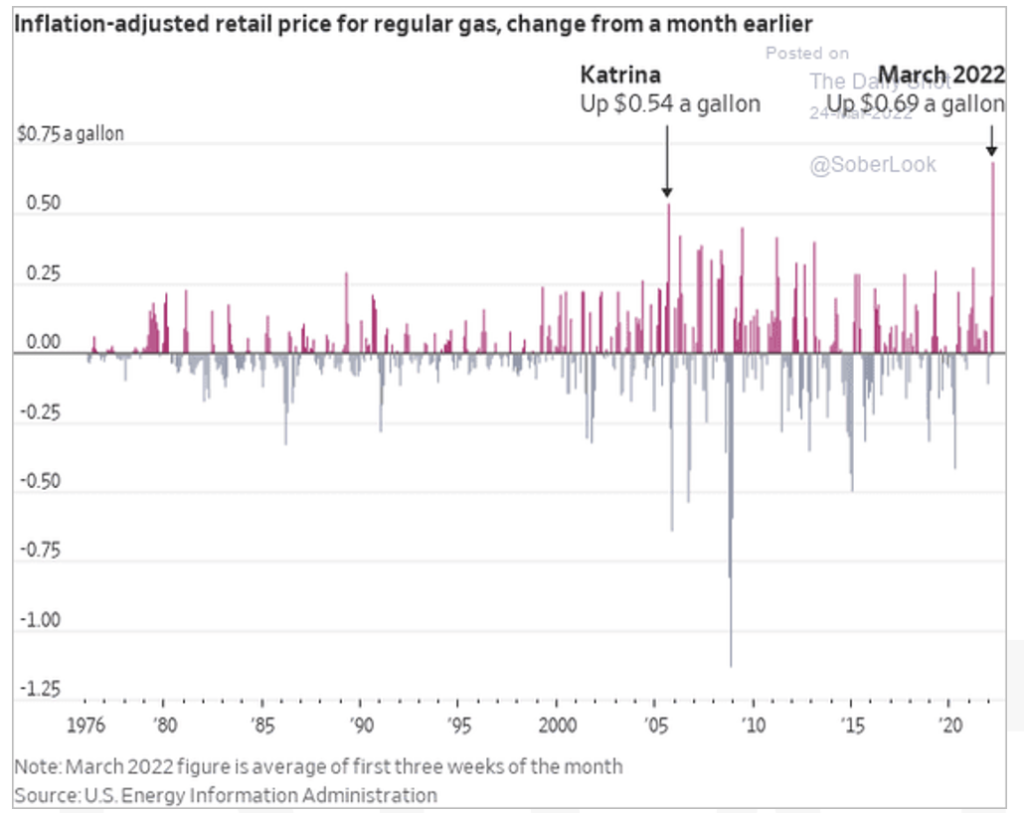
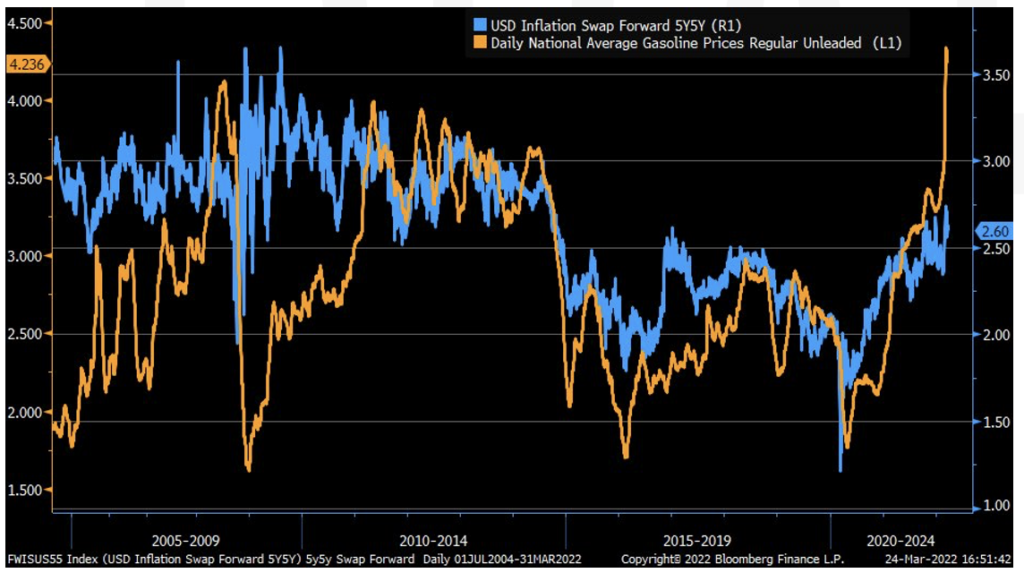
While the data suggests the rate of change of a gallon of gas, currently at $4.244 per gallon, has been record-breaking, overall inflation expectations by the market are less significant.
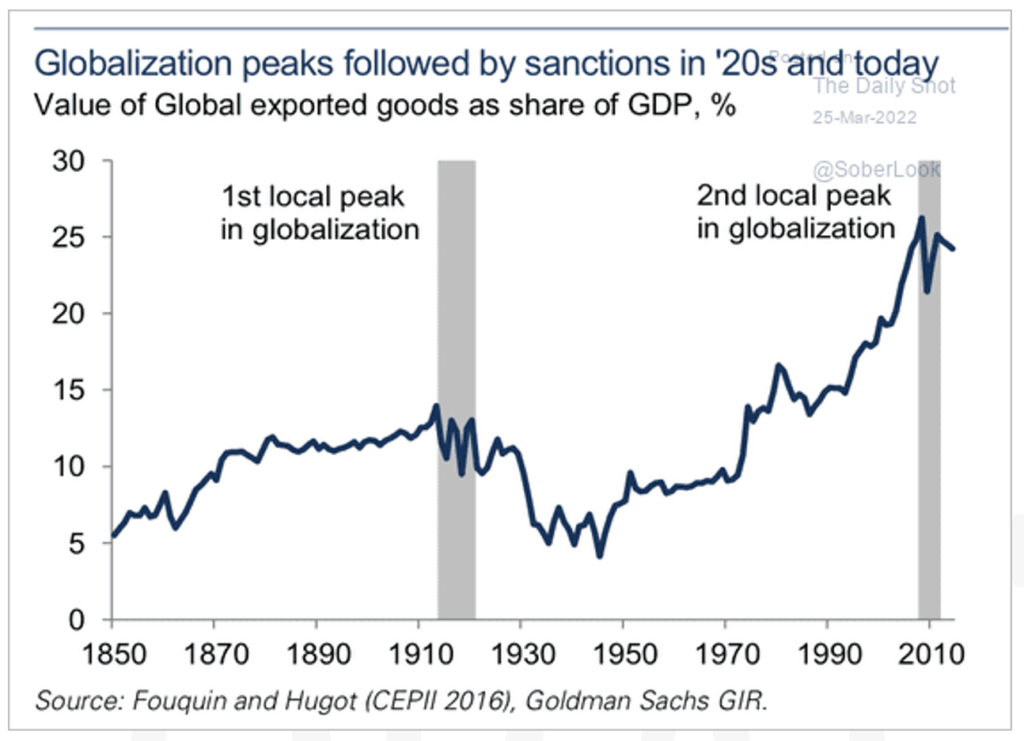
The future of globalization has crept into the dialogue and will be part of the discussion for some time to come. COVID and the ensuing supply chain disruptions created the dialogue but recent sanctions have exacerbated them. As the debate continues, note the chart below for some context.
Equities
Major U.S Equity market indices remained resilient this week despite the ongoing geopolitical tensions between Russia and Ukraine and growing expectations of faster interest rate increases. Investors continued to digest and be patient around economic news during the week; on Thursday, data showed jobless claims fell to a 52-year low giving a boost to investor sentiment. The S&P 500 returned +1.81% for the week while the Dow returned +0.31%; both benchmarks logged a second straight week of gains. The tech-heavy Nasdaq rose +1.9% helped by investors buying the dip on Thursday sending notable names on a rally. The Russell 1000 Growth large-cap stocks outperformed small-caps in the Russell 2000 Growth considerably; large-caps returning +1.71% on the week while small-caps returned -1.55%. YTD, Large-cap growth still outperforms small-cap growth stocks. In the Value space, large-caps outperformed small-caps as well with the Russell 1000 Value returning +1.59% and the Russell 2000 Value returning +0.70% on the week. Energy (+7.38%) stormed past the other 10 S&P sectors and remains on top YTD returning +43.27% thus far. Materials (+4.11%), Utilities (+3.48%), and Tech (+2.19%) also had notable positive weekly returns. Globally, markets remained strong – the MSCI World returned +1.31% although Europe specifically ended up in negative territory returning -0.72%.
Fixed Income
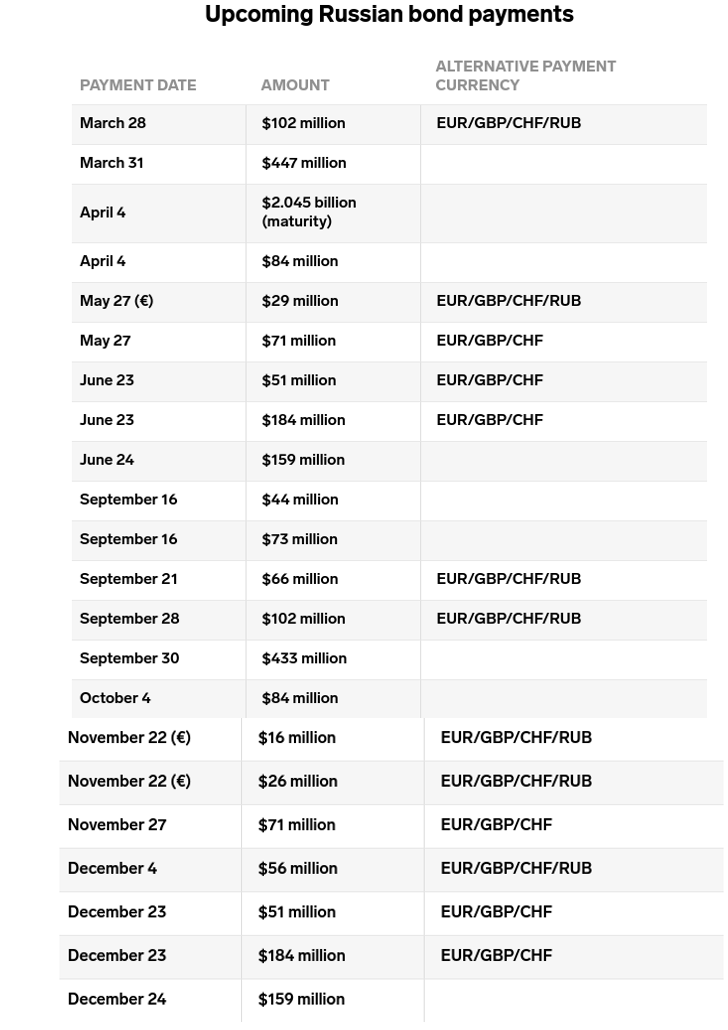
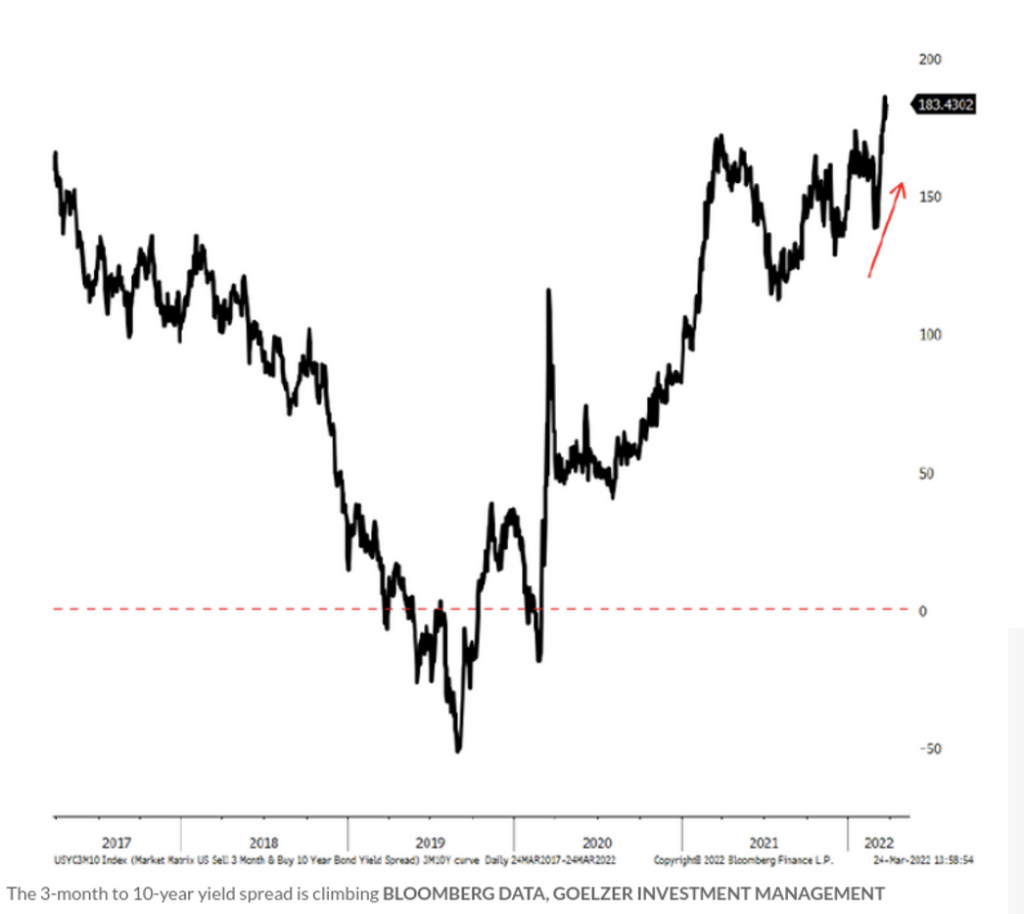
Fed Chairman Jerome Powell started the week with more hawkish comments to combat inflation than how he left us last week during the FOMC meeting. He pointed out that the steepening gap between the forward implied rate on the 3-month Treasury Bills vs the current 3-month level is equivalent to giving the Fed a green light to raise rates more aggressively implying a positive economic outlook. The Fed could potentially have consecutive 50 basis point rate hikes in the upcoming meetings if necessary. The Curve this week flattened significantly with the gap between the 5 and the 10-year yields reaching single digit basis point difference, not seen since 2006. The yield on the 10-year Treasury Note got as high as 2.5% which has not been seen since May 2019. The 2-year Treasury Note ended the week at 2.28%, only 20 basis points behind the 10-year Treasury Note and 30 basis points behind the 30-year Treasury Bond. Russian corporate debt saw some struggles this week with interest payments being frozen by a few banks due to the sanctions on Russia. Severstal, a Russian steel and mining company, had its interest payments frozen by Citigroup this week because of regulatory investigations. On Tuesday another Russian based steel and mining company, Evraz, had its interest payments blocked by French bank Société Générale due to sanctions around Roman Abramovich who is one of their biggest investors. Russian foreign debt is still a concern despite making interest payments of $117 million due last week and $66 million sent to bond holders this week. Russia, which has $40 billion in foreign currency denominated debt, must make a further $4.5 billion of payments this year. A Russian default is more than likely to happen if the war persists, it is just a matter of when. The next test for Russian foreign debt will be the payment due on April 4th when they need to pay $2.045 billion for a maturing bond.
Source of chart: JP Morgan: Emerging Market Strategy Team
Source: Marketwatch
Hedge Funds
Similar to last week, hedge fund performance was positive in conjunction with positive returns from global indices. Global hedge funds have almost recovered March’s month-to-date losses while North American funds have moved into positive territory. Asian funds were the best absolute performers but European hedge funds were the best relative performers as Europe was the only region down on the week and hedge funds were up. The top 50 crowded longs in North America and Asia were positive drivers, both outperforming their relative indices. Crowded shorts in Europe were the biggest winners declining 3.2% vs. the Euro STOXX 600 that was down 30 basis points. Hedge funds were sellers of North America, Europe and Japan but small buyers of AxJ. In North America, despite the sector’s outperformance, hedge funds were tech sellers with a 70/30 split between long sales and short additions. Hedge funds bought EU energy for the 4th straight week with this week the largest buying since March 2019. US long/short equity gross and net leverage remained unchanged while Europe and AxJ rose for high single digits for the week.
Data Source: AGWEB Farm Journal, Bloomberg, CDC, CNBC, the Daily Shot HFR (returns have a two-day lag), Financial Times, Fund Fire, Morningstar, Pitchbook, Standard & Poor’s, US Census Bureau, the Wall Street Journal, Morgan Stanley and Goldman Sachs Capital Introduction and IR+M
This report discusses general market activity, industry, or sector trends, or other broad-based economic, market or political conditions and should not be construed as research or investment advice. It is for informational purposes only and does not constitute, and is not to be construed as, an offer or solicitation to buy or sell any securities or related financial instruments. Opinions expressed in this report reflect current opinions of Clearbrook as of the date appearing in this material only. This report is based on information obtained from sources believed to be reliable, but no independent verification has been made and Clearbrook does not guarantee its accuracy or completeness. Clearbrook does not make any representations in this material regarding the suitability of any security for a particular investor or the tax-exempt nature or taxability of payments made in respect to any security. Investors are urged to consult with their financial advisors before buying or selling any securities. The information in this report may not be current and Clearbrook has no obligation to provide any updates or changes.