
Economic Data and Market Highlights
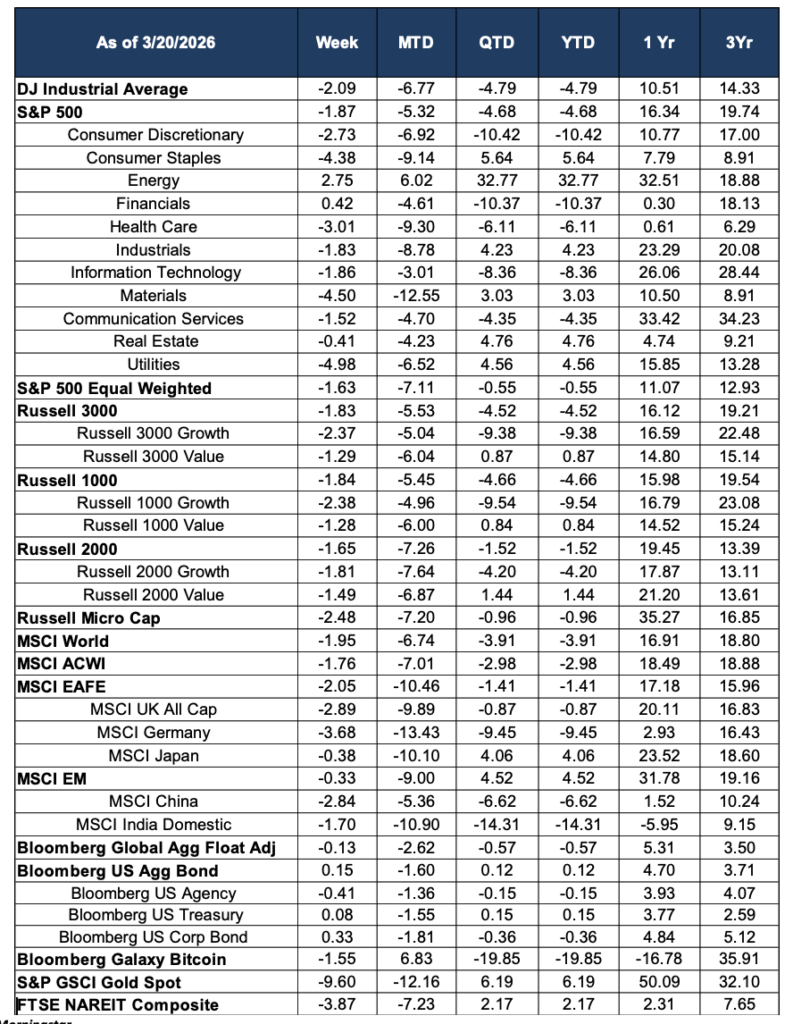
Global equity markets extended their slide during the week ending March 20, 2026, marking a fourth consecutive week of losses and culminating in a technically significant event: the S&P 500 closed below its 200-day moving average for the first time in more than 200 sessions, ending the week at approximately 6,606—roughly 6% below its late-January record high of 6,978. The Dow Jones Industrial Average fell 2.08% on the week, pushing its year-to-date loss to -4.79%, while the S&P 500 also declined approximately 1.9%, bringing its four-week drawdown into increasingly uncomfortable territory. Two forces dominated market sentiment this week: a Federal Reserve that held rates steady and offered few near-term cuts, and a geopolitical conflict in the Middle East that continued to disrupt global energy markets and stoke inflationary fears.
Macro Backdrop: Fed Holds, Inflation Persists
The Federal Open Market Committee voted unanimously on Wednesday to hold its benchmark federal funds rate in the 3.50%–3.75% range, a decision that was widely expected. Fed Chair Jerome Powell acknowledged that inflation progress had stalled short of the Committee’s hopes, noting the personal consumption expenditures price index is now expected to run at 2.7%—both headline and core—in 2026, above the Fed’s 2% target. Futures markets now price in just a single rate cut for the year, with the first meaningful probability of easing not appearing until September or October. Adding to the inflationary backdrop, the February Producer Price Index came in hot, rising 0.7% month-over-month—the largest monthly gain since July 2025—and accelerating to 3.4% year-over-year on the headline with core PPI at 3.9%, driven in large part by tariff-related cost pressures on metals and industrial inputs.
Compounding these domestic concerns, the ongoing conflict between U.S.-Israeli forces and Iran has partially disrupted shipping through the Strait of Hormuz, sending Brent crude prices surging toward $110 per barrel. While Fed officials maintained that the energy shock would likely prove transitory, the combination of tariff-driven goods inflation and an oil supply disruption created a challenging backdrop for risk assets across the board.
Domestic Equities
Selling was widespread within domestic equity markets, though the pattern of winners and losers told a clear story. Energy remained the standout, gaining another 2.75% on the week as oil prices surged, and extending its extraordinary year-to-date advance to +32.77%—by far the leading S&P 500 sector. Financials were the only other sector to post a weekly gain, rising a modest 0.42%, though they remain deeply negative on the year at -10.37% YTD. Every other sector declined, with Utilities suffering the steepest weekly loss at -4.98%, an unusual development for a typically defensive sector that may reflect rate sensitivity as investors recalibrate their rate-cut expectations. Materials fell 4.50%, and Consumer Discretionary and Communication Services both declined sharply as well.
The S&P 500 Equal Weighted index fell 1.63% on the week, a modest outperformance versus the cap-weighted index, suggesting that mega-cap names faced slightly more pressure. The growth-versus-value dynamic continued to favor value: Russell 1000 Growth declined 2.19% on the week versus -1.29% for Russell 1000 Value, and the pattern held across all capitalization tiers. Small caps underperformed, with the Russell 2000 dropping 2.48% and now down 4.20% year-to-date. The S&P 500’s breach of the 200-day moving average, ending a 214-session streak above that long-term trendline, drew considerable attention from technical analysts and may prompt further repositioning in the weeks ahead. Notably, however, Wall Street strategists including UBS maintained their year-end S&P 500 target of 7,700, characterizing the current pullback as a valuation reset rather than the start of a structural bear market.
International Equities
International developed markets demonstrated relative resilience compared to U.S. equities this week. The MSCI EAFE index fell just 0.83%, a notable outperformance, and the index remains essentially flat on a year-to-date basis at -1.46%—significantly better than U.S. large caps. Japan was the best performer among major developed markets, declining only 0.38% despite a difficult month-to-date of -10.10%. Germany and the UK were modestly lower at -0.88% and -1.11%, respectively. Emerging markets were broadly weaker, with the MSCI EM falling 1.10% on the week. India continued to face headwinds, though it has shown signs of stabilization after its steep declines in prior weeks. The MSCI ACWI fell 1.76%.
International outperformance year-to-date remains a significant portfolio theme. MSCI Japan is up 4.06% for the quarter, MSCI EM is up 3.78%, and the UK has eked out a small positive return, all while U.S. equities have struggled. The case for geographic diversification has rarely been more evident in recent memory.
Fixed Income
In a week characterized by equity weakness, fixed income provided a measure of relief. The Bloomberg U.S. Aggregate Bond Index returned a positive 0.15% on the week, its first meaningful weekly gain in several weeks, as investors sought safety amid the equity selloff. The Bloomberg Global Aggregate Float Adjusted index was essentially flat at -0.13%. U.S. Treasury bonds benefited from flight-to-quality demand, and credit spreads widened only modestly. Year-to-date, the Bloomberg U.S. Aggregate remains down a modest -0.38%, reflecting the ongoing tension between declining rate-cut expectations and periodic bouts of risk-off demand for duration assets.
Alternatives & Commodities
Alternatives provided a broadly positive contribution this week. Bitcoin surged 9.60%, its strongest weekly gain in some time, recovering a portion of its year-to-date losses; the Bloomberg Galaxy Bitcoin index now stands at +6.19% for the year despite significant intra-quarter volatility. Gold also advanced, with the S&P GSCI Gold Spot rising 1.87% on the week, continuing to benefit from geopolitical uncertainty and its role as an inflation hedge. Real estate, however, was a notable laggard: the FTSE NAREIT Composite fell 3.87% as the higher-for-longer rate environment weighs on property valuations.
Looking Ahead
The market faces a complex and evolving set of headwinds as Q1 draws to a close. The Fed’s signal of only one rate cut in 2026, combined with persistently elevated inflation readings and oil prices potentially pushing toward $110 per barrel, limits the policy cushion available to absorb further economic or geopolitical shocks. The S&P 500’s breach of its 200-day moving average is a technical development worth monitoring—historically, such events have preceded both brief consolidations and more sustained corrections depending on the macro backdrop. Investors will be closely watching upcoming inflation data, corporate earnings guidance, and any developments in the Middle East that could shift the energy price trajectory. The relative strength of international equities, value over growth, and defensive commodity exposure all suggest that portfolio positioning remains in a state of meaningful transition.
Source: Morningstar