Economic Data Watch and Market Outlook
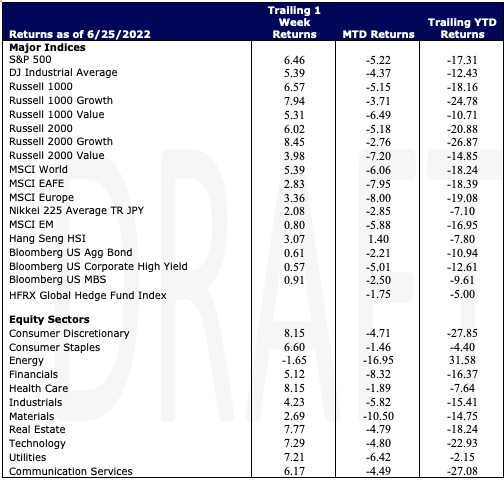
Global stocks were up during the week as the MSCI World Index rose 5.39%. The S&P 500 rose almost 6.5% and the MSCI EAFE rose 2.83%. The rise in the benchmarks eased some of the pain this year with the benchmarks down 6.06%, 5.22%, and 7.95% YTD respectively. The US Aggregate Bond index rose 61 basis points with the ten-year at 3.136 % as of Friday’s close.
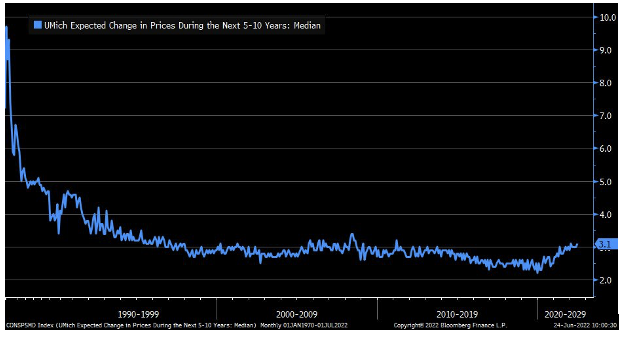
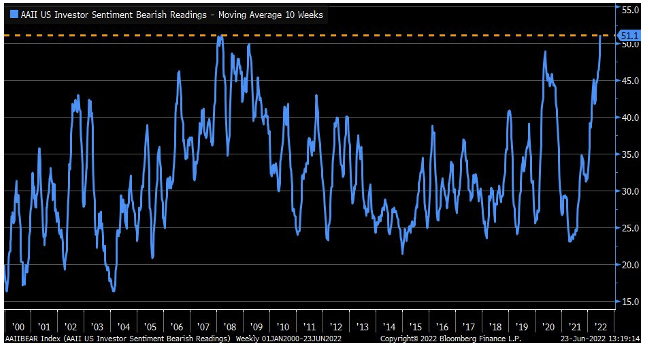
While equity markets surged during the past week, sentiment continues to trend downward. Some of the fuel for this past week’s rise could be attributable to rebalancing among institutions as well as the Russell Index rebalancing. Adding further fuel, trading volumes in S&P 500 Futures is five times lower than its average according to JP Morgan. The Michigan Consumer survey was revised downward and the American Association of Individual Investors (AAII) is roughly where it was in March of 2008.
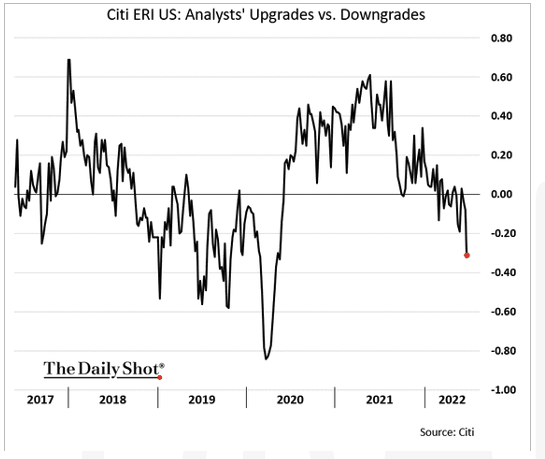
Regarding US stock indices, in past weeks we’ve talked about much of the fallout in equities a result of cheap money and high valuations contracting back to their historical norms. The ‘E’ in the P/E ratio was something that we’ve been watching, and expectations are being revised downward week to week. Currently there are more downgrades than upgrades by Wall Street analysts as the chart below indicates.
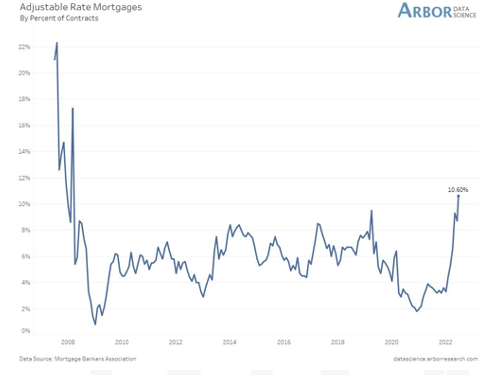
As sentiment has been dampened by the markets, we continue to watch the consumer. Noted in our last writing was the significant amount of travels the consumer was undertaking via flights and driving, both of which have experienced significant cost increases. In addition to higher gas prices, we continue to watch housing costs increase. The number of adjustable rate mortgages is not nearly as great as in the Great Financial Crisis but it has trended upward as rates have climbed. Adjustable rate mortgages are the only solution for some in the current market. While we do believe the consumer is in a much different and better position than in 2008, it is clearly a datapoint that should be watched as other factors change.
Equities
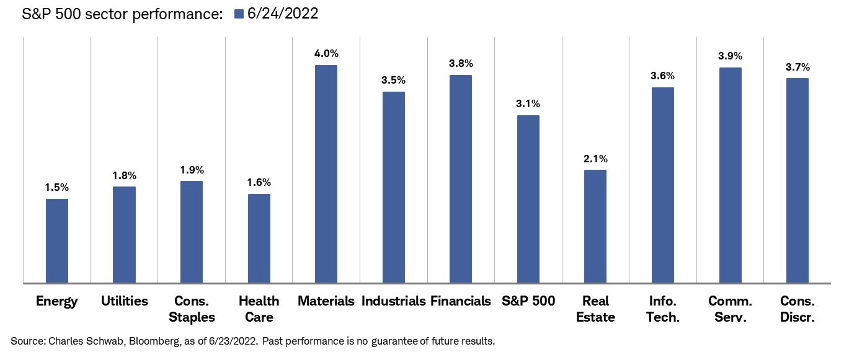
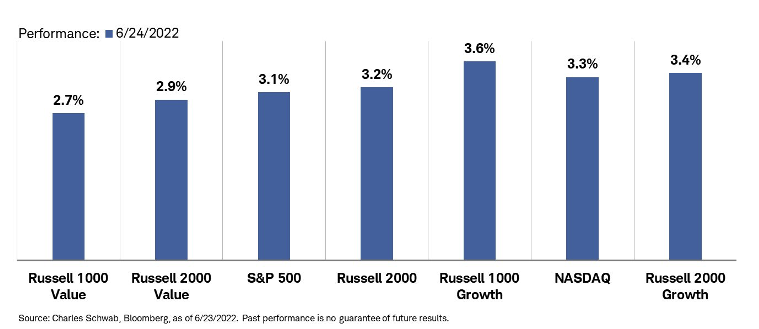
As noted above equities surged during the week and within the S&P 500 all economic sectors advanced as well as all capitalization and style classifications.
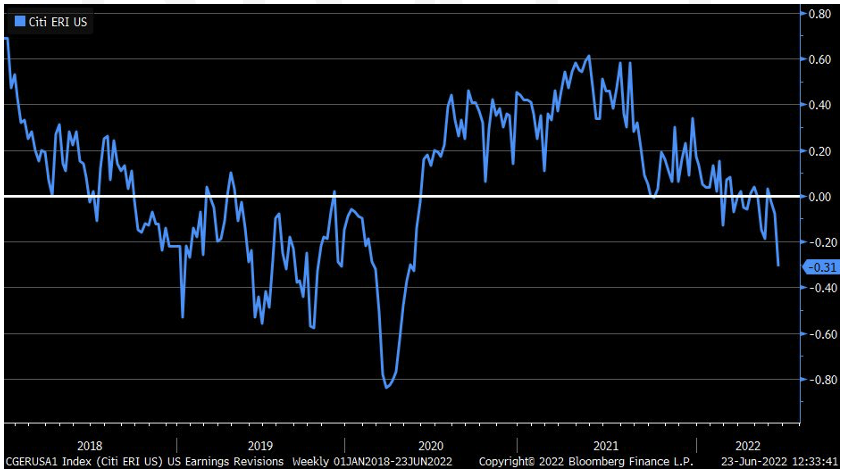
Also noted above was the deterioration in earnings. We showed the trend in analyst recommendations, but earnings revisions should also be considered. Note the downward trend in the most recent quarter.
European stocks jumped 3.36% for the week while Emerging Market Equities advance just 80 basis points in USD terms. While the Nikkei rose 2.08% for the week, investors, especially non-Japanese investors are selling stocks and bonds but the recent economic data may point to a slightly stronger consumer as data has not declined as significantly as expected.
Fixed Income
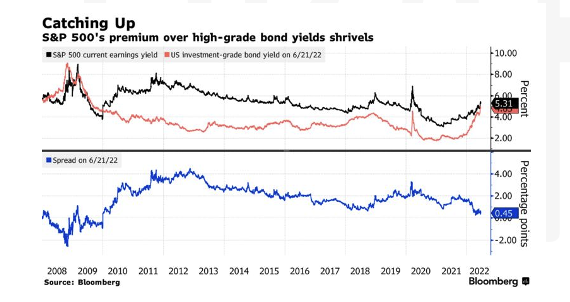
Treasuries saw some relief this week across the curve with yields dropping on the week as Jerome Powell testified to Congress on inflation and the state of the economy. Rising rates across the fixed income market have provided a cause for concern for investors thinking there is nowhere to hide when weighing whether to allocate to stocks or bonds in public markets. Due to the long stretch of historically low rates up until this year investors have flooded towards riskier asset classes to capture a higher yield. Stocks tend to provide an average of 5.3% of their price in earnings making the gap between the two asset classes yield closest since 2018. The spread on the yield for investment grade debt, which has been much lower than what the S&P 500 earnings yield has been for the past few years, is closing significantly this year and at the same level. The last time the yield on investment grade debt was above the average yield on S&P 500 companies was in 2009. Company earnings have done well comparatively but have been below expectations due to record high guidance which has been lowered as of late by many companies across the board. S&P 500 companies have plunged over 20% year to date with tech specifically getting hit the hardest, down closer to 30% year to date. Bond portfolios have also been hurt due to aggressive increase in yields but a stabilization on yields with stocks getting crushed does put more of an emphasis on adding back to the bond portion of portfolios investors have been long been neglecting in recent years. The 10-year Treasury yield is currently north of 3% which seems like a decent trade off considering their yield entering 2022 was 1.5% while US high-grade debt got as high as 5% which is levels not seen since 2009. We are coming to a point in time where investors are beginning to give bonds a look again as riskier assets have seen increased outflows.
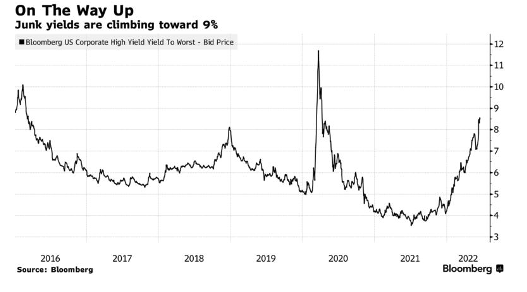
Average US junk bond yields have been climbing as well getting to levels not seen since before COVID, climbing approximately 8% and exceeding the S&P 500 earning yield by over 3% which is the largest premium since early 2016 per Bloomberg. If equities are expected to return anything less than low double digit returns over the next year and a half, high yield bonds could be an alternative if defaults are avoided.
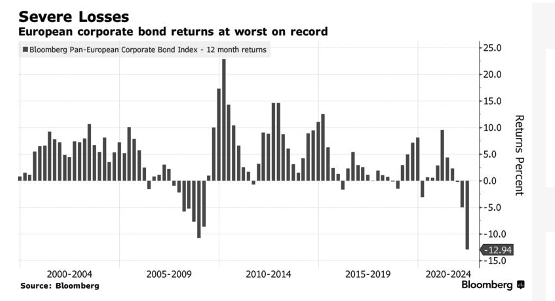
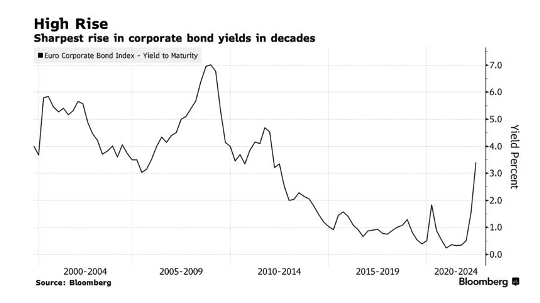
Meanwhile in Europe, the bond landscape has taken a huge hit and seen the biggest sell off since before the 2008 crisis due to the drastic rise in yields. European Investment Grade debt has fallen for 7 months in a row which is the longest monthly losing streak since 1998 and is the worst return in European Investment grade debt history. UK inflation read 9.1% on Wednesday with 160 basis points more of tightening priced in from the Bank of England for this year. ECB Governing Council Member Mario Centeno said that normalization of ECB monetary policy will be done gradually. The average yield on Euro corporate bonds has risen 2.9% this year versus 3.4% on the Bloomberg Aggregate. This is much higher than what we saw in 2008 which was a rise of 1.62%, the next highest rise in yields. In Asia, high-grade dollar bond spreads widened as recession concerns paused investors towards risk assets. Chinese private sector property firms weighed on the market as their largest developer, Garden Holdings, was downgraded to junk level by Moody’s on Wednesday.
Hedge Funds (as of Thursday, June 23rd)
Hedge funds were able to protect against losses the first few weeks of the month by running with more moderate directionality. Unfortunately, this resulted in funds only able to capture a portion of this past week’s rally with the average global fund +20 bps compared to +220 bps for the MSCI World (20% up capture). North America based funds were the best performers for the week, posting gains of 140 bps which was 40% of the S&P’s gains. This was close to expectations as the average net exposure for these funds is just under 40%. MTD and YTD global and North America funds’ losses remain way below their relative indices with global -2.1% MTD/-5% YTD compared to -8.4% MTD/-20% YTD for the MSCI World and North America -3% MTD/-12.5% YTD compared to -8% MTD/-19.8% YTD for the S&P. In other regions, Europe-based funds were flat on the week while Asia funds were up slightly in the ~30-50 bps range. Crowded longs in all regions outperformed their relative benchmarks but the spread between crowded longs and shorts in North America and Asia ended the week in negative territory. Even with US markets closed on Monday, this week ended one of the largest weeks of buying (excluding Japan) in 2022 with N. America leading the way. North American equity long/short funds were the largest net buyers adding to longs and covering shorts. Multi-strategy/macro and stat-arb/quants added to the buying, but to a lesser extent, via long adds. In Europe, funds were small net buyers both by adding to longs and covering shorts. AxJ flows were more muted with buying in China and selling in Taiwan. Japan was the only net sold region through long trims.
Private Equity
The agricultural technology or “agtech” vertical continues to see elevated venture capital activity in Q1 despite market volatility negatively affecting many other verticals and markets. In Q1 of 2022 agtech saw 222 deals, $3.3B raised, and deal values up 15% quarter over quarter. The highest deal count fell into the Precision Ag subsector (58 total deals) followed by the Ag Biotech subsector (50 total deals). This strong funding momentum has elevated median deal sizes and valuations across most all agtech growth stages, however, early-stage deal sizes in particular, have grown by 59%, while pre-money valuations rose a staggering 67% year over year.
With the war in Ukraine continuing, global supplies of fertilizer and other critical agricultural goods, such as wheat and corn, have experienced surging prices and have become a mounting threat to global food supplies and stability. Analysts credit the record setting capital flowing into agtech to three main driving factors – increased concern for food security, data-driven productivity gains, and environmentally friendly agricultural techniques. Analysts believe agtech innovation will be imperative to boosting crop yields to counter the recent reduction in supply and growing demand and capital will continue to flow heavily into this vertical.
Data Source: Bloomberg, BBC, Charles Schwab, CNBC, the Daily Shot HFR (returns have a two-day lag), Jim Bianco Research, Market Watch, Morningstar, Pitchbook, Standard & Poor’s, the Wall Street Journal, Morgan Stanley, Goldman Sachs and IR+M