Economic Data Watch and Market Outlook
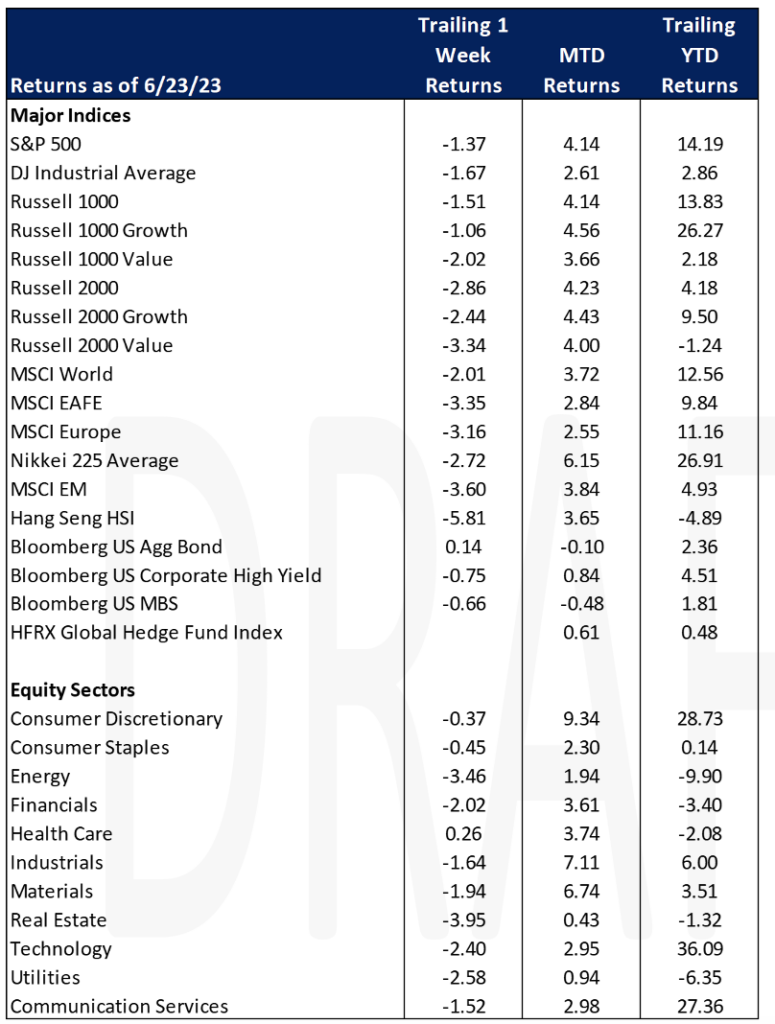
Global equities retraced gains this week as the MSCI World Index dropped 2.01%. US bonds we up slightly at 14 basis points. Investors continue to speculate when a recession will occur, how long it will take, and how severe it will be. One of the key measures of a recession is a decline in GDP and those results will be released in the US on Thursday. Economic results continue to be mixed but there are few signs of significant negative cracks. Often, as we’ll see below, for every one negative sign, a sign of significant strength is also released.
Recently released economic data indicates a slowdown in the manufacturing economy, heightening concerns of an impending recession. In June, the US Manufacturing Purchasing Managers Index (PMI) experienced a decline to 46.3, falling short of both the projected 48.4 anticipated by analysts and the previous reading of 48.4 in May. Similarly, Germany’s manufacturing PMI declined to 41 in June, falling short of the expected 43.5. Additionally, the US services index for June stood at 54.1, slightly contracting from May’s 54.9 but exceeding analysts’ expectations of 54.
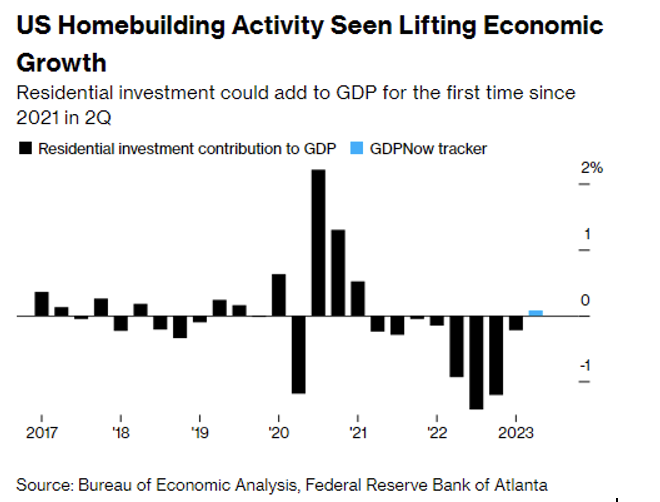
New construction activity is at its highest level in over a year, with the Federal Reserve Bank of Atlanta’s GDP now tracker projecting residential investment added 0.1% to growth in GDP in Q2, marking the first positive contribution to GDP since early 2021.
The Bank of England raised its key rate by 50 basis points this week to 5.0%, the highest since 2008. The move was aggressive, but the UK suffers from one of the highest inflation rates of the G7 countries.
Friday night, Russian-aligned mercenary group, PMC Wagner, led by Yevgeny Prigozhin, invaded the southern Russian city of Rostov. The group then turned toward Moscow, approximately 1,028 miles away. Wagner had been a force supporting and aiding the invasion of Ukraine but Prigozhin became vocal after Russian forces attacked his troops. Prigozhin is wanted by the FBI as it is alleged, he played a key role in interfering with US elections. The drama ended as quickly as it started as the group turned away after it was agreed that charges of treason would be dropped. Prigozhin has also sought exile in Belarus.
Over the last several months, the Panama Canal has experienced a significant drought. As drought has affected the water supply for the country, a back-up source is the canal. As a result, the canal operators will begin restricting travel through the canal on Sunday by limiting the weight of the ships to compensate for shallower waters. Time also becomes a constraint because only so many ships can pass in a day and, as a result, are carrying less cargo. Canal traffic is already down by over 20% at the end of the operators’ fiscal year (September). A trip from the Gulf of Mexico to Japan through the canal, carrying LNG for example, takes 21 days. To go around takes 34 days. This likely will affect shipping costs going forward.
The US will report durable goods orders on Tuesday along with retail and wholesale inventories on Wednesday. On Thursday the US will also release Core Personal Consumption Expenditure (PCE). Core PCE has been noted multiple times by Fed Chair Powell as a key metric the Fed uses to evaluate inflation. Another key metric, jobless claims will also be released on Thursday.
Equities
US equity markets fell during the abbreviated trading week with most losses occurring on Tuesday as investors and traders had a chance to digest the previous week’s Fed governor speeches and the Chair’s testimony before Congress. The gap between large cap and small cap stocks continued to widen with the Russell 1000 falling 1.51% and the Russell 2000 down ;
-2.86%. On a year-to-date basis, large cap stocks are up 13.83% while small cap stocks are up only 4.18%. Investors are starting to take notice. Despite the aggregate numbers noted above, small cap stock ETFs have seen a $3.5 billion net inflow year-to-date. Of that amount, the Wall Street Journal reported that $1.6 billion flowed in last week.
The annual reconstitution of the Russell benchmarks were finalized on Friday. The reconstitution mostly affects stocks in the mid cap holdings that move from the Russell 2000 to the Russell 1000 and vise versa. Holdings may also shift between the growth and value benchmarks.
US equity funds saw their largest outflows in 12 weeks, totaling $16.47 billion, as investors reacted to concerns about the Federal Reserve’s hawkish stance on interest rates. Healthcare, industrials, and tech sectors were hit hardest, experiencing outflows of $906 million, $199 million, and $158 million, respectively, while financials attracted $933 million in net purchases. US investors continued to buy bond funds for the second consecutive week with net purchases of approximately $2.58 billion, focusing on US government and general domestic taxable fixed income funds.
The only sector in positive territory for the week, Healthcare, saw stocks, rise just 26 basis points. Healthcare stocks, 13.56% of the benchmark, are second in weight to Information technology stocks at 28.13%. Energy and real estate stocks were hit the hardest, falling 3.46% and 3.95% respectively but the two sectors accounted for only 6.35% in aggregate of the S&P 500.
Outside of the US, European equities declined as indicated by the MSCI Europe (-3.16%). Japanese equities declined albeit not as precipitously (Nikkei 225, -2.72%) as core inflation eased for May. Markets were closed in China on Friday for their annual Dragon Boat Festival, but the Hang Seng index fell 1.61% on Friday. The benchmark fell 5.81% for the week as there were concerns about emerging market equities which was reflected in the MSCI EM benchmark falling 3.6% with Chinese equities accounting for the largest weight in the benchmark of 29.56%.
Fixed Income
Treasury yields fell to start the week then traded higher into Thursday in response to Fed Chair Jerome Powell’s speech on Wednesday, with yields ultimately ending the week relatively unchanged from where they opened. The 2-year Treasury yield rose 1 bp, the 10-year Treasury yield fell 3 bps, and the 30-year Treasury yield fell 4 bps. Bond index returns were mixed, with the Bloomberg US Aggregate Bond Index rising -0.14%, the Bloomberg US Corporate High Yield Index falling -0.75%, and the Bloomberg US MBS Index falling -0.66%.
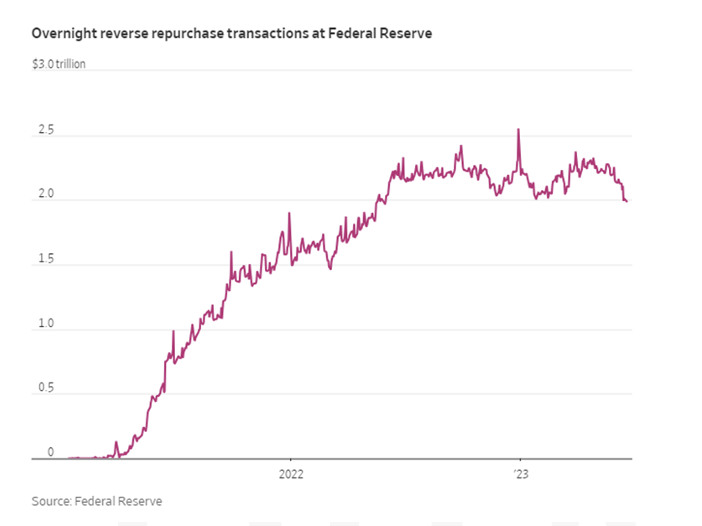
Money-market (MM) funds are putting less cash into the Federal Reserve’s borrowing program, a positive sign that the Fed’s efforts to replenish their reserves have not disrupted markets. Overnight repurchase agreements, which borrows from MM funds and returns the money the next day had its largest fall in over six months on Thursday, with reverse repo falling below $2T for the first time since June 2022. As of the end of May, the Treasury General Account had fallen to as low as $50B, it has now rebounded to $135B as of Wednesday but remains below the Fed’s targeted balance of $600B which they hope to reach by the end of September.
Brazilian companies have seen the amount of distressed corporate debt rise by 26% this year, with a large wall of maturities in 2025 and 2026. $12B of corporate notes are now trading at distressed levels, with 4 of the 10 worst performing issuers in EM coming from Brazil. Companies that borrowed heavily during the times of low interest rates face risks of restructuring and defaults. Investors are selling lowest rated corporate bonds due to their extremely poor performance, with CCC rated corporate bonds now down 59% YTD.
Hedge Funds
Hedge Funds (HFs) performed relatively well vs. their benchmark indices amidst a broader decline in equity indices, with the average global fund losing 40 bps for the week vs. the MSCI World declining 1.2%. Americas-based equity L/S funds were down the most in relative terms compared to their benchmark, with the average fund ending down ~65 bps vs. the S&P down ~60 bps. Most of the pain was due to longs underperforming whereas shorts actually worked quite well (top 50 crowded shorts fell ~2.5% this week). Europe-based HFs held in much better as they were down just 20 bps for the week vs. the Euro STOXX 600 index tracking greater than 2.5% lower. Asia-based HFs are down ~80 bps WTD, but L/S funds who are focused on China were down more at -3.1% through Thursday. The top 50 crowded longs in Asia (many of which are names in China) fell ~4.8% for the week. After buying global equities on a net basis for six consecutive weeks, HFs turned net sellers during this past week, with the selling being the largest week observed since September 2022. HFs trimmed directional exposure to equities across all regions, with North America (NA) and Asia ex-Japan (AxJ) ultimately ending as the two most net sold regions. In NA, ~85% of the net selling was attributable to short additions while the rest came from HFs selling longs, meaning that the de-grossing which played out during the weeks ending June 9th and 16th has finally subsided. HFs added to shorts across almost all single-name sectors, but index-level hedges were the main source of the short adds with funds adding to shorts in broad-based index-level products. HFs also sold longs in macro products, the largest since January 2019. Across sectors, consumer staples ended as the most net sold followed by healthcare (mostly large-cap names), resulting in the “defensives” theme being net sold for the week. TMT-related industries were slightly net sold, but when isolating flows to mega-cap names and AI-beneficiaries (where HFs are overweight), the flows were much more muted on a net basis. The only sectors to be net bought in NA through Thursday were real estate, materials, financials (ex-banks which were paired back) and consumer discretionary. AxJ was the next most net sold region, most of which was concentrated within China. Most of the selling in China was seen on the long side, with H-shares driving the bulk of the activity but ultimately, HFs were net sellers of all share types. Europe was also slightly net sold, with most of the selling here attributable to short additions, which were concentrated in healthcare, consumer discretionary, industrials and financials. Flows to Japan were much more muted on a net basis as HFs added to both longs and shorts in relatively small amounts throughout the week – flows to the region have been relatively flat in net terms over the past ~ two months.
Private Equity
As large-scale vehicles targeting large-cap deals continue to lose their appeal in eyes of investors, mid-market focused buyout funds are dominating private equity fundraising in the United States. In Q1 of 2023, middle-market buyout funds raised a total of $49.9 billion representing 88% of the total capital raised in the United States. According to PitchBook’s US PE Middle Market report, last year such funds only represented 45.4% of the total capital raised by the industry. Additionally, middle-market buyout deals also remained the largest share of all buyouts in Q1 of this year.
Analysts credit the increased interest in middle-market funds partly to the notion that investors believe it is an easier place to find mispriced assets. Unlike large-cap companies, mid-size businesses without investors have fewer and limited financing options in an economic downturn which allows PE buyers to purchase assets at attractive prices. Additionally, buyers tend to be less reliant on debt to finance smaller buyouts allowing them to bypass expensive borrowing. Lastly, smaller buyouts are offering cheaper valuation multiples, according to Pitchbook data. Over the last year the median EBITDA multiple was 6.4x for buyouts less than $100 million while the median EBITDA multiple for mega-deals, or deals worth $5 billion or more, was 16.9x.
Authors:
Jon Chesshire, Managing Director, Head of Research
Elisa Mailman, Managing Director, Head of Alternatives
Katie Fox, Managing Director
Michael McNamara, Analyst
Sam Morris, Analyst
Sam Friedberg, Summer Associate