Economic Data Watch and Market Outlook
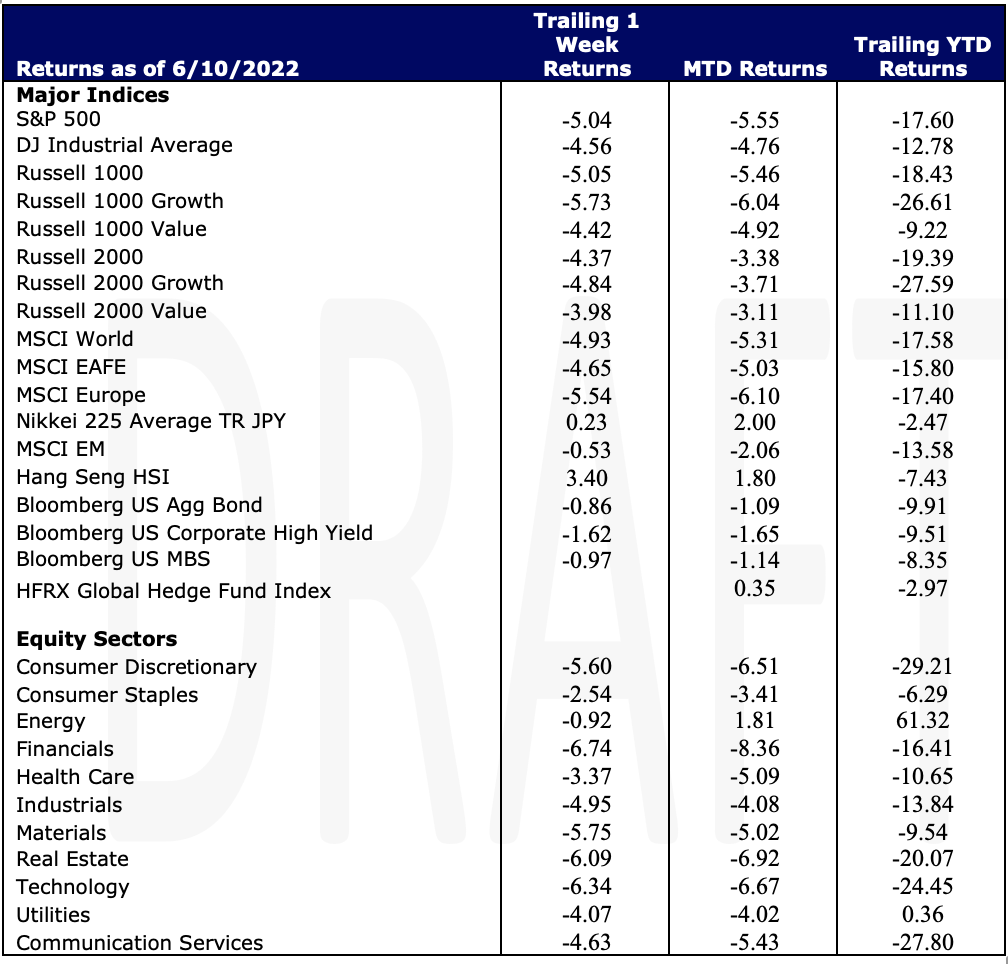
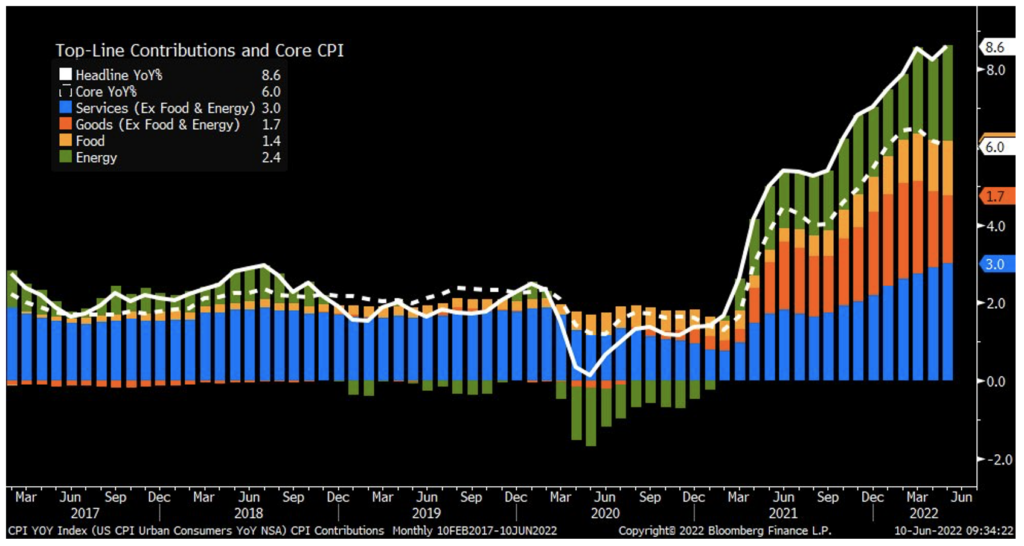
Global stocks were down during the week as the MSCI World Index fell 4.93%. The S&P 500 fell 5.04% and the MSCI EAFE fell 4.65 basis points. For context, the S&P need to fall just 63 points more to be in an official bear market. The US Aggregate Bond index fell 86 basis points with the ten-year rising to 3.037% as of Friday’s close. Consensus thinking, Clearbrook included, began to drift toward the belief that perhaps inflation had peaked. However, the data disproved this as Friday’s CPI release came in above expectations at 8.6% (a forty-year high) versus consensus of 8.3%. Core came in at 6.0% versus expectations of 5.9%.
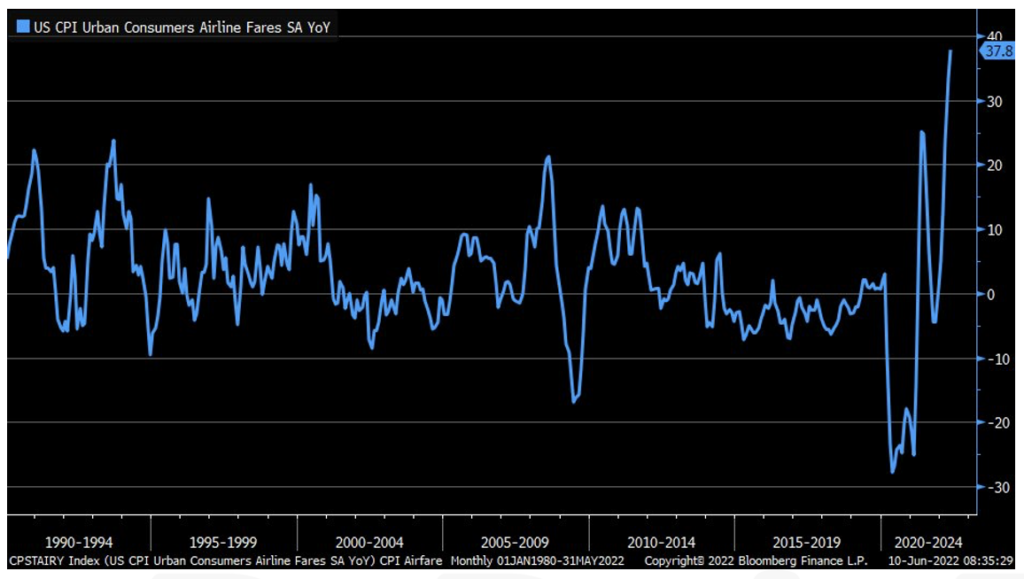
Last week we mentioned that consumers have continued to spend and highlighted air travel as one of those areas of spend. On a year over year basis, as of the latest CPI release, air travel has increased almost 38%.
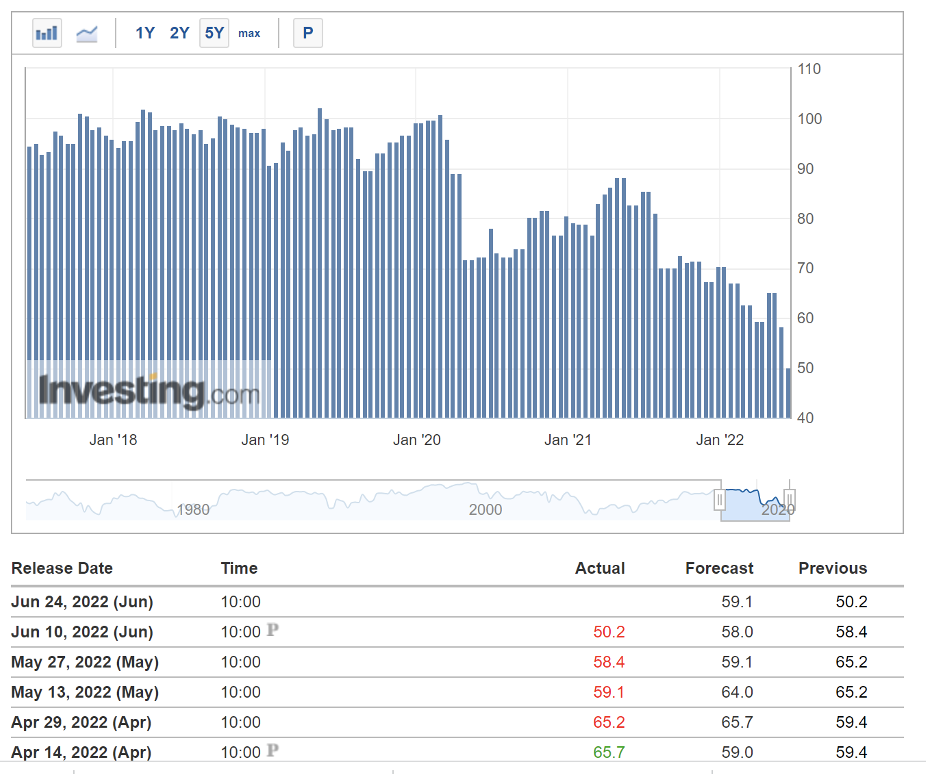
Higher prices are taking their toll on consumer sentiment as well with the University of Michigan Consumer Survey results also released on Friday. Results are released bi-weekly with Friday’s release being preliminary data. The survey polls roughly 500 consumers on their views of the economy, inflation and expectations. Each result came in far below expectations for the month with the most popular (Sentiment) offering a rating of 50.2. Consensus was for a reading of 58.0. See Chart and historical results below for context.
This week, eyes turn to Europe as several key bond auctions are taking place in France and Italy. France and Germany will release inflation numbers and the EU will release industrial production numbers. In the US we’ll learn about Small Business Optimism, Mortgage borrowing, business Inventories and, a very important Producer Price Index release.
Equities
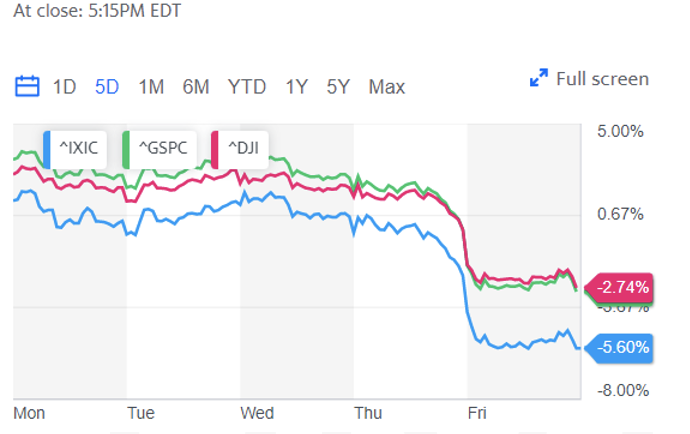
The major US stock indices slid this week posting their 9th weekly decline out of the last 10 weeks. An inflation report released Friday steepened losses on the week after the report was worse than most investors and economists had expected – the inflation report reported a 40-year high. The VIX, the volatility index that measures investors’ expectations of short-term US stock market volatility, surged 6% on Friday after the inflation report – reversing its course after declining the last two weeks. The S&P 500 lost -5.04% on the week while the Dow Jones returned -4.56% and the Nasdaq shed -5.60% – the S&P and Nasdaq’s worst weekly performances since January 2021.
All 11 S&P 500 sectors ended the week in negative territory with Tech -6.34% and Financials -6.74% being the most impacted by Friday’s sell-off. Major tech names struggled on Thursday with Meta Platforms plummeting -6.4% on the first day of trading under new ticker META; ending more than a decade of trading under the ticker of FB, Amazon dropping more than 4% and Apple sliding 3.6%. Netflix also fell more than 5% after Goldman Sachs downgraded the stock to “sell.” Growth stocks also led the way for losses this week with the Russell 1000 Growth and Russell 2000 Growth both plummeting -5.73% and -4.84%, respectively The tech-heavy Nasdaq is now down -23.38% YTD while the S&P 500 is down -17.60% YTD. Globally, stocks also took a hit this week with the MSCI World down -4.93% and Europe losing -5.54%.
Fixed Income
After some short-lived easing on bond prices yields experienced more upward pressure this week with the 10-year yield crossing the 3%-mark late Monday which is a common benchmark that other parts of the bond market use for pricing. The move above 3% was the first time in almost a month and capped an 8-day losing streak where rates remained stable but creeped higher over the following 5 days. Rates to start the year skyrocketed following a few rate hikes by the Fed, stabilized a bit, and now seem to be creeping up again leading up to the Fed meeting next week. Have we seen a ceiling in yields? Hard to call but expectations are for another 50-basis point rate hike from the Fed next week. The ECB’s approach flipped this week it was announced they will increase rates for the first time since 2011 due to increasing inflation seen in Europe. Euro high-grade bonds are down 10.1% this year while US dollar and Sterling denominated credit markets have been worse year to date.
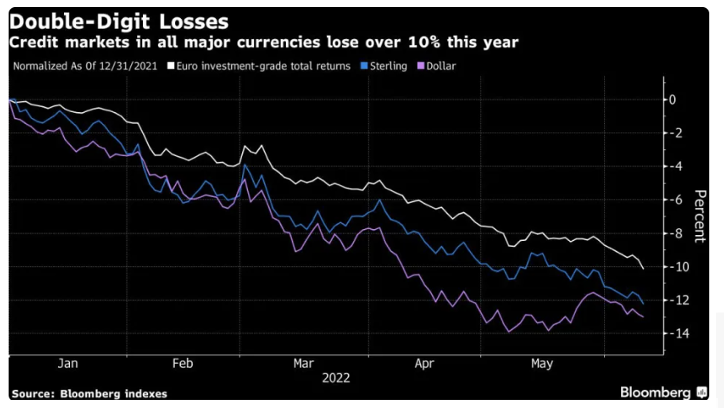
This year Euro credit decline had been worse than any other previous year to date drop. Following Covid the Bloomberg Euro Aggregate Corporate Total Return index dropped as much as 7.3% and 6.1% following the collapse of the Lehman Brothers in 2008. Following the ECB’s decision to tighten policy, the disparities across the European credit markets have varied. The yield gap between the 10-year Italian bonds and German 10-year bonds widened this week and has widened to the biggest amount since May 2020. The selloff in bonds has seen a ripple effect in the currency markets as flows into the dollar have increased among attractive Treasury yields. The pressure now is on the Japanese Yen, which is very yield sensitive, and is approaching its lowest level in 24 years. The falling Yen has elevated inflation pressure in Japan which has seen their credit market suffer a handful of corporate bond cancellations as borrowing costs have risen from all-time lows. Issuers in Asia’s Dollar bond market sold $6.3 billion of notes while Chinese high-yield dollar bonds dropped on the dollar Friday. Dollar notes of Greenland Holdings, who put forth a delay of a note repayment saw gains for a second week. US private credit has seen defaults increasing and might stay there for the time being as inflation and rising interest rates cut into profits for smaller sized companies. Inflation came in hotter than expected for May and next week is a big one for monetary policy as the Fed meets mid-week to discuss their course of action.
Hedge Funds (data Friday June 3 through Thursday June 9)
Hedge funds were able to post gains to start the month but have given back the gains with major indices trending lower later in the week. That said, global hedge funds were only down 15 basis points compared to -170 bps for the MSCI World Index. This leaves global funds still slightly positive for the month at +20 bps and YTD -270 bps compared to -2.2% MTD for the MSCI World and -14.6% YTD. Americas based hedge funds were down most for the week, but only down 60 bps compared to -220 bps for the S&P 500. Amid inflations concerns, consumer discretionary experienced net outflows week/week. Information technology witnessed strong short selling momentum in the US as the sector continues to battle the challenging market environment. In other regions, EU-based funds were slightly positive for the week at ~10 bps and now the average fund in Europe is down < 1%. The spread between crowded longs and shorts were negative in North America with both sides of the book contributing small negative alpha. In Europe, crowded longs and shorts both contributed positive alpha and in Asia ex-Japan the spread was positive as longs performed very well (up almost 4%). Hedge funds have been net sellers of AxJ for the majority of 2022 with the bulk coming from China, both short additions and long trimming. As equities in the region have rallied, hedge funds switched to buying, with this past week ranking the most in more than 2 years. Similar to the selling, a large portion of the buying was in China. So far in June, the buying has made up for about 20% of the selling for the first 5 months of the year. Most of the buying has been in ADRs, with flows to H and A shares marginally positive.
Private Equity
After being largely unaffected by the pressure the tumultuous market has put on larger tech companies, early-stage startups are beginning to feel the pressure as VCs take an increasingly conservative approach to early-stage deals.
Over the last two to three months seed and series A valuations have dropped significantly while early-stage investors focus on startups that can meet more demanding revenue targets than were required in the past. Last year, the typical strong series A deal was raising approximately $20 million at a post-money valuation of $120 million. Currently, these deal sizes have been cut in half with an average raise of $10 million and a $50 million post-money valuation. Historically, the minimum for raising a series A was about $1 million in annual recurring revenue, however that bar has now been moved up to between $1.5 million and $2 million. As a result, founders are facing substantial increased dilution in their equity stakes.
One exception to this trend is Web3 and other crypto-related seed deals where seed rounds are raising an average of $7 million at a $37 million post-money valuation. Although the value of coins and shares of crypto have fallen recently, investors continue to heavily invest in early-stage Web3 projects as crypto has recovered strongly after past downturns.
Data Source: Bloomberg, BBC, Charles Schwab, CNBC, the Daily Shot HFR (returns have a two-day lag), Jim Bianco Research, Market Watch, Morningstar, Pitchbook, Standard & Poor’s, the Wall Street Journal, Morgan Stanley, Goldman Sachs and IR+M