Economic Data Watch and Market Outlook
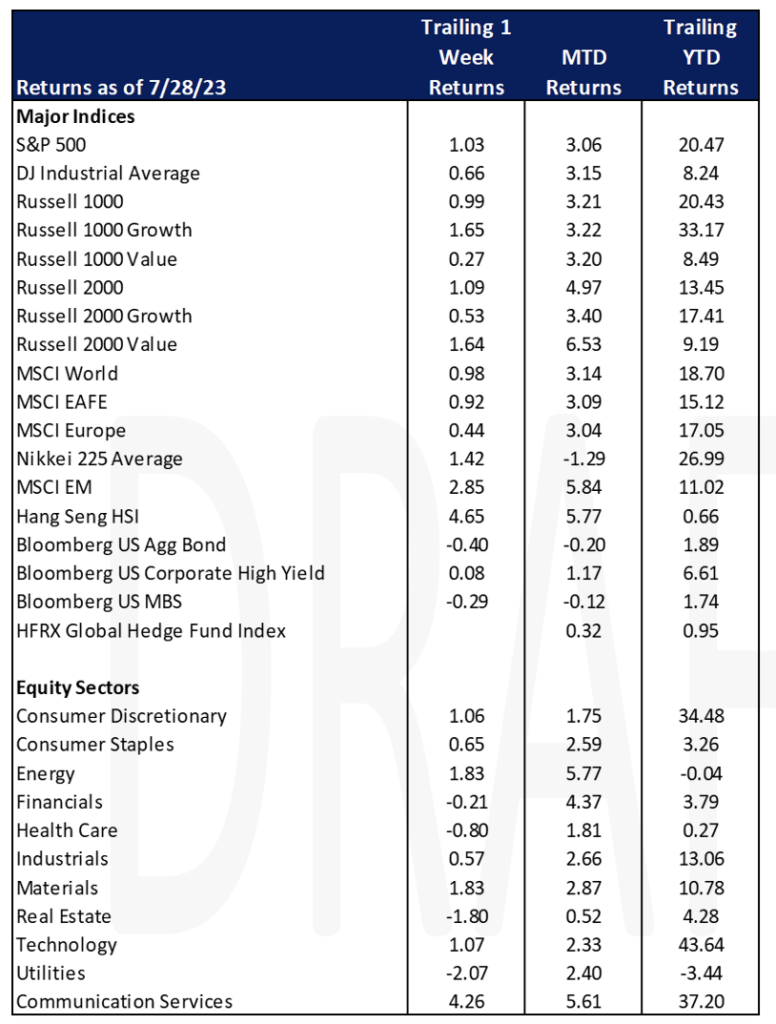
Equity prices were strong around the globe this past week. The S&P 500 rose 1.03% to bring its year-to-date return to 20.47%. Developed markets rose slightly less, with the MSCI EAFE Index up 0.92% bringing their year-to-date return to 15.12%. Emerging markets had the largest increase with the MSCI EM Index up 2.85% but it’s year-to-date return still trails the developed markets, up 11.02%. The US Aggregate Bond Index slipped 40 bps for the week bringing its year-to-date return to 1.89%.
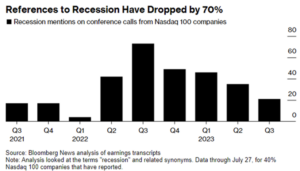
Stock gains in the technology sector surpassed 43% year-to-date on Friday as tech firms in the US are expressing less concern about recession indicating optimism about a smooth economic landing. Thus far references about a recession within earnings reports are down 70% from a year ago. The decline in references to recession and economic slowdown suggests a positive outlook on business prospects and potential earnings improvements. The Federal Reserve Chair, Jerome Powell, also stated that the US central bank’s economists are no longer predicting a recession.
We’ll expand more on private equity later in this note, but Pitchbook released it first half 2023 report this week. It noted that private equity firms took 43 public companies private in the first six months, taking advantage of depressed equity prices. Continuation funds have also become popular which has allowed some companies to stay private while realizing value for investors.
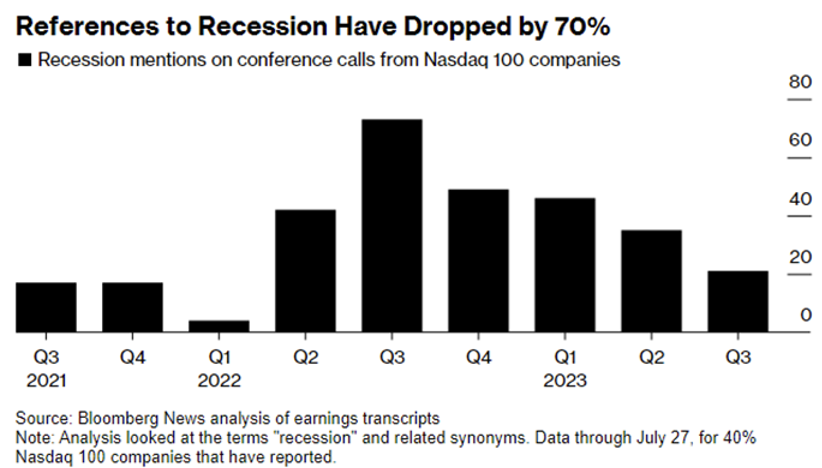
According to Refinitiv Lipper data, global money market funds saw inflows of $38.74B for the week ending July 26th, the largest influx since July 5th. US and European money market funds saw inflows of $24.62 billion and $11.84 billion respectively, on a net basis. Meanwhile, Asian funds saw $231 million of outflows for the week. Global equity funds drew about $1.3 billion worth of inflows after seeing $2.2B in outflows during the previous week.
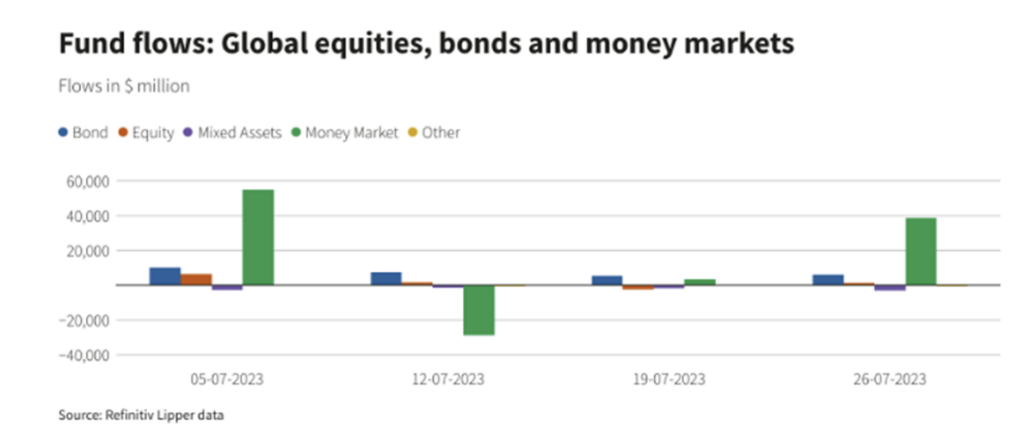
This week we’ll learn more about the health of employment in the US with the JOLTS results being reported by the Bureau of Labor Statistics (BLS) on Tuesday. JOLTS is a survey that evaluates job openings, recruitment, hirings and departures. ADP will release its Nonfarm Employment report on Wednesday and Challenger, Gray and Christmas, and the Institute of Supply Management will both release their employment reports on Thursday. Friday the BLS will report non-farm payroll data, the labor force participation rate and U6, the total workforce that is unemployed. The upcoming week’s reports are really something to look forward to as optimism is growing among employers and the last report related to jobless claims fell more than expected and the trend of those claims were decreasing.
Equities
Equities were positive to start the week but sold off slightly Thursday following rate hikes by a few global central banks. Despite that, equity markets, both US and developed increased roughly 1%. Growth stocks pulled the broad benchmarks higher versus value with the Russell 1000 Growth up 1.65% versus the Russell 1000 Value up 0.27%. While small stocks rose roughly the same amount (Russell 2000, up 1.09%) as their larger cap counterparts, the opposite held true from a style standpoint with the Russell 2000 Growth rising 0.53% and the Russell 2000 Value up 1.64%.
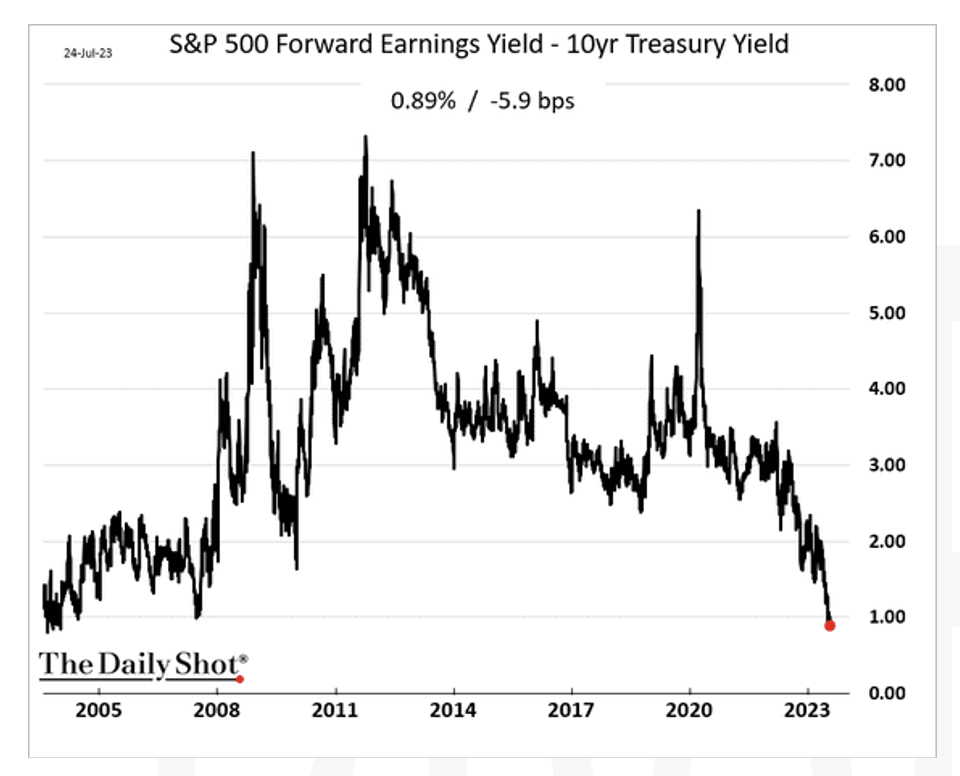
As we consider other areas of return and the rise of Treasury yields, the equity risk premium hit its lowest level since ’08. The Equity Risk Premium is calculated by looking at the S&P 500’s forward earnings yield and subtracting the 10-year Treasury yield.
Wednesday, the Dow Jones Industrial Average saw its 13th straight day finishing in the green which is the longest winning streak since 1987. The Dow closed in the red Thursday which would have marked the 14th consecutive day of gains and the longest winning streak in 126 years or since 1897.
Information technology stocks continued to drive the broad US equity benchmarks rising 43.64% year-to-date. Consumer discretionary and communication services also have had robust returns YTD, up 34.48% and 37.20% respectively. Energy and materials were the top performing sectors on the week, both rising 1.83%, but energy has struggled YTD while materials have risen a respectable 10.78%.
Meta Platforms jumped 7% following stronger than expected earnings while Microsoft fell 0.7% following its earnings release. Other big names that saw a positive bounce following favorable quarterly results were McDonalds, Comcast, Royal Caribbean, Lam Research, and AbbVie.
Regional bank stocks were a pocket of strength Wednesday after news that PacWest Bancorp and Banc of California are merging in an all-stock transaction.
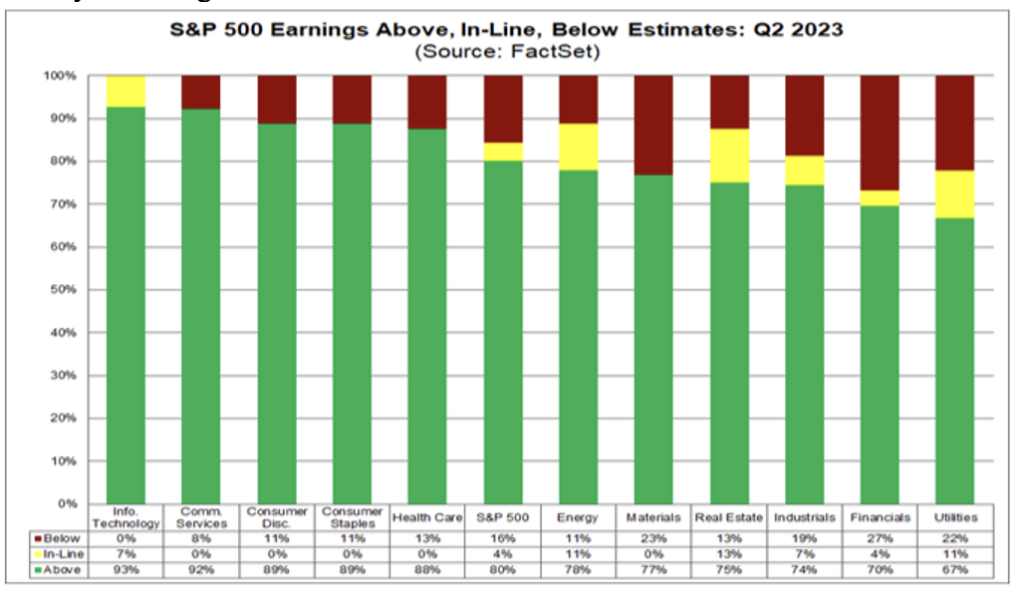
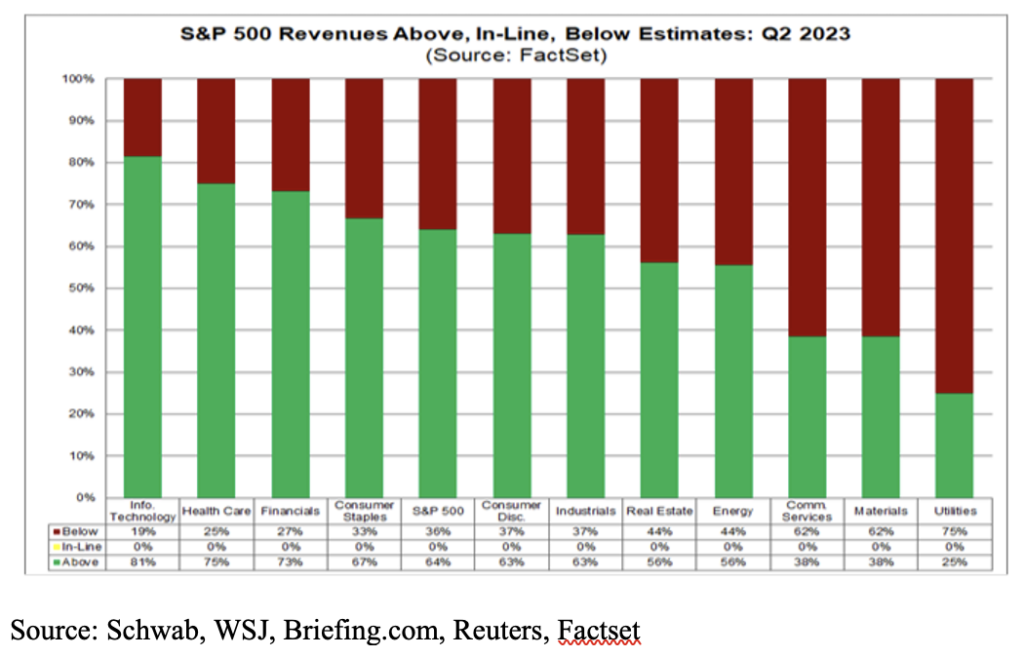
To close the week, 80% of companies have reported better earnings estimates than projected, which is above the 5-year average of 77% and above the 10-year average of 73%. In aggregate, companies have reported earnings 5.9% above estimates which is slightly below the 5-year average of 8.4% and below the 10-year average of 6.4%. 64% of S&P companies have reported revenues beating estimates which is slightly below the 5-year average of 69% and the 10-year average of 63%.
China Evergrande Group announced Thursday it had applied to the Hong Kong Stock Exchange to resume trading. Shares have been suspended from trading since April of 2022 following a debt crisis that hit the company in 2021.
The company posted its financial results on Wednesday, reporting a net loss of 71.12 billion yuan for 2021 and 2022 combined.
As of May, the China Evergrande Group, mostly known for its real estate business, has an electric vehicle unit, the New Energy Vehicle Group. It reported delivery of over 1,000 units since last October. European EV makers are beginning to feel the wave of firms in China that are producing cheap EV options. France’s Renault said Thursday it was projecting to cut productions costs for its electric models by roughly 40%. This projection is from 2027 onwards, but Chief Executive Luca de Meo said that production costs would see a positive impact from the second half of this year due to falling raw material costs. In 2022, Chinese car makers made up 9% of the European EV market which doubled from the prior year’s market share. Pressure from the US side has also been seen by price cuts from Tesla which has cut into its margins.
Fixed Income
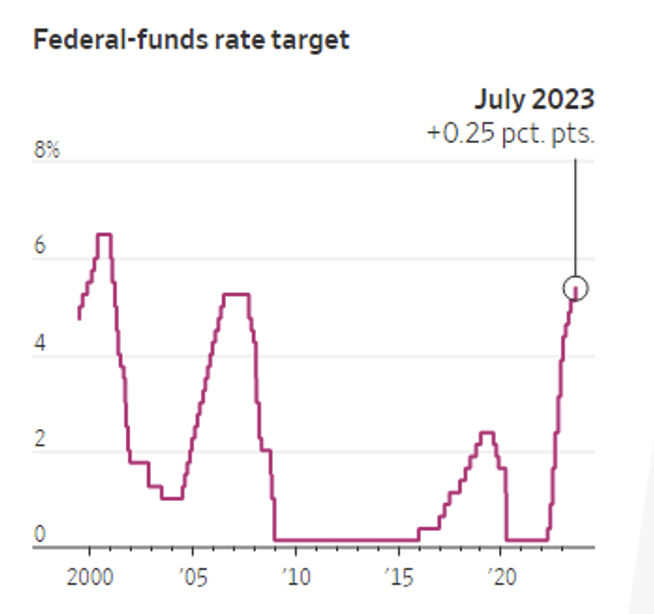
The Federal Reserve raised interest rates by 25 bps on Wednesday the 26th, bringing the benchmark Federal Funds rate to between 5.25% and 5.5%, a 22-year high. Fed Chair Jerome Powell said that it was too early to determine whether the hike would be the last increase of the year as the Fed is scheduled to meet three more times this year with the next meeting taking place in September. Several Fed officials have signaled they would prefer to raise rates again at the September meeting, while others have endorsed a longer pause. Ultimately rates ended the week higher with the 2-year Treasury yield rising 5 bps to 4.87%, and 10-year and 30-year Treasury yields both rising 12 bps to 3.97% and 4.03%, respectively. The Bloomberg US Aggregate Bond Index fell -0.40%, the Bloomberg US Corporate High Yield Index rose 0.08%, and the Bloomberg US MBS Index fell -0.29%.
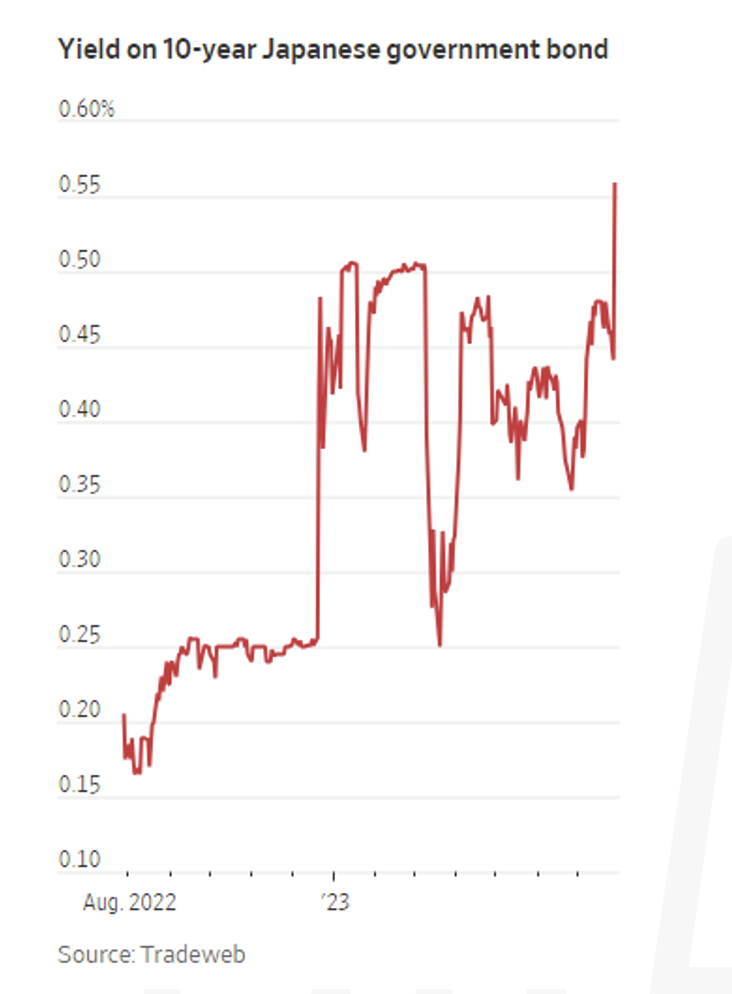
The Bank of Japan made an important shift in its monetary policy on Friday, signaling that it will tolerate higher yields on long term Japanese government bonds. The BOJ announced that a 0.05% cap on 10-year government bond yields was now just a suggestion and not a rigit limit, with the new hard cap being set at 1%. Although Japanese bonds offer lower yields than US Treasuries, the increase could provide even more incentive to purchase Japanese bonds in order to avoid unfavorable currency moves. The market impact so far has been minimal, but there is worry that this change in policy could cause Japanese investors to to slow down their buying of foreign bonds.
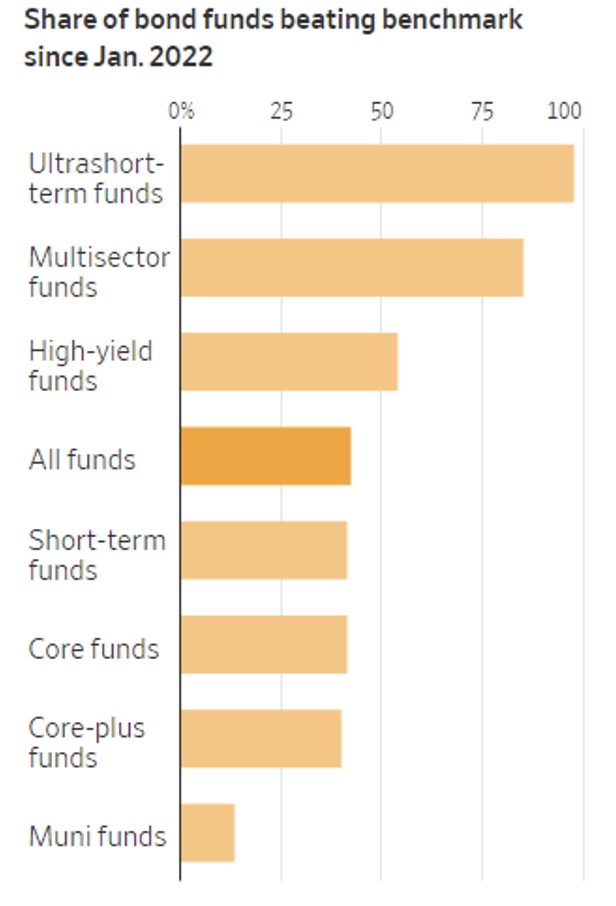
Passive bond funds have outperformed actively managed funds since the start of the Fed tightening cycle. According to Morningstar Direct, out of 2000 actively managed bond funds across a broad array of strategies, 58% were unable to beat comparable bond indices after considering fees. During this tightening cycle, Morningstar’s benchmark for core funds lost 11.2%. Out of 125 active managers within the benchmark 95 returned within 2% of the benchmark. Prior to 2022, active managers had seen much better performance. On a number of time periods ranging from one to ten years ending in 2021, between 60% and 91% of active bond managers beat their benchmarks. In 2023 only 14% of 102 intermediate municipal bond funds exceeded the base Morningstar benchmark.
Hedge Funds as of Thursday, July 27th
According to Morgan Stanley, historically profit and loss (P&L) tends to be more challenged in periods of de-grossing, but the month of July is shaping up to be an outlier, largely due to longs held by long/short (L/S) equity clients continuing to perform well. Returns for hedge funds (HFs) globally were flat this past week vs. the MSCI World posting small gains (+40 bps), which leaves them up ~90bps MTD vs. MSCI World at +2.7% (capturing 1/3rd of the upside). Americas-based L/S equity funds performed generally in-line with the S&P 500 this past week (average US L/S -10 bps vs. S&P flat), and they are now up half of what the index is up MTD (US L/S +1% vs. S&P +2%). In other regions, EU-based funds experienced more challenged performance as they ended flat despite the Euro STOXX 600 rising 1.4% higher WTD through Thursday. Asia-based funds fared better, particularly China-focused L/S equity managers as equities in the region rallied (China L/S +2.3% vs. MSCI China +4%). On the month, European funds are capturing a third of the relative index’s gains whereas Asia HFs captured roughly 50% of the rally in equites. China L/S managers are the top performing strategy in July as they are up +3.9% MTD vs. MSCI China +6.5%.
Global equities were bought in the largest amounts seen YTD and what drove the buying was unchanged from what transpired in prior weeks as it was entirely driven by HFs covering shorts. Given HFs also trimmed longs globally, this led to the largest week of de-grossing YTD with ~65% of the flow driven by US equities, 25% from EU equities, and the remaining balance from Asia equities. In North America (NA) most of what was unwound throughout July had been in sectors with high short exposure due to these names rallying. Not only did the pace of covering accelerate this past week, but it broadened out across most sectors. Index-level products made up a greater portion of the total covering this past week vs. weeks prior. At the single-name level, financials (most industries), hotels, restaurants & leisure, and software were the most covered. Similar to the short covering in NA, the pace of long selling didn’t slow either. Tech (software), financials (this week it was capital markets vs. banks last week), and industrials (ground transportation) continued to drive the long selling. Communications services was the lone exception to the single-name long selling as HFs were outsized buyers of interactive media on the back of favorable Q2 earnings prints posted by some of the larger names within the space this past week. Consumer staples were heavily net sold both from long and short sales. Similar to NA, the bulk of what was covered in Europe was seen in EU index-level products while most single-name sectors in the region also saw net covers in small amounts (led by EU financials, particularly capital markets, industrials, staples, and energy). The short crowding factor monitored by Goldman Sachs continued to outperform/squeeze during the week. The long selling in Europe was more concentrated across a handful of industries (hotels, restaurants & leisure, textiles, apparel & luxury goods, and aerospace & defense). In AxJ, the majority of the buying this past week took place on Tuesday in China through long buys as well as short covers in (fairly evenly spread across most share-types). This was the largest buying in China since October 2022. HFs also unwound shorts across most sectors in Japan.
Private Equity
Private equity’s exit activity experienced a significant boost in Q2, marking the first sequential quarterly rise in value in 12 months, according to PitchBook’s Q2 2023 US PE Breakdown. Exit value reached $87.3 billion, representing a remarkable 67% surge from the previous quarter. This resurgence was partly driven by four deals over $1 billion that were announced late in the quarter. Additionally, corporations played a crucial role in the recovery of exit activity, responsible for a record-breaking 65% of exits in Q2, indicating a healthy private capital ecosystem.
After a robust year of exiting investments in 2021, both asset sales and IPOs slowed down due to declining public and private valuations surpassing the drop seen during the financial crisis 15 years ago. While the decline in buy-side dealmaking wasn’t as steep, it led to a record-low exit-to-investment ratio of 0.32x in Q2. For every three deals executed, the private equity industry only exited one investment.
Successful exits included the sales of fintech software provider Adenza to Nasdaq for $10.5 billion and IT management software developer Apptio to IBM for $4.6 billion, with impressive valuations of 20.2x revenue and 12.5x revenue, respectively, providing encouragement for further upticks in exits. Additionally, two PE-backed companies, Kodiak Gas Services and Savers Value Village, made their debuts on the NYSE in late June through IPOs, contributing to the positive trend.
Despite the signs of recovery, the PE industry needs more deals to close to prevent a pile-up of deals that could hinder fund performance and fundraising. Industry experts stress the importance of PE firms focusing on selling assets after a period of active buying to maintain a healthy balance. Overall, the uptick in exits and increase in exit value represent positive signs of recovery for the private equity industry, but continued efforts are needed to sustain and build upon this momentum.
Authors:
Jon Chesshire, Managing Director, Head of Research
Elisa Mailman, Managing Director, Head of Alternatives
Katie Fox, Managing Director
Michael McNamara, Analyst
Sam Morris, Analyst
Josh Friedberg, Summer Associate
Data Source: Apollo, Barron’s, Bloomberg, BBC, Charles Schwab, CNBC, the Daily Shot HFR (returns have a two-day lag), Goldman Sachs, Jim Bianco Research, J.P. Morgan, Market Watch, Morningstar, Morgan Stanley. Pitchbook, Standard & Poor’s and the Wall Street Journal.