
Economic Data Watch and Market Outlook
Friday marked the week and month-end with global equities up 2.24% and 6.05% respectively as per the MSCI World Index. On a year-to-date basis, the benchmark is up 15.09%. The rise has largely been driven by large cap tech names with the NASDAQ up 39.95% YTD. Bonds fell for the week and month with the US Blomberg Aggregate benchmark falling 26 basis points and 36 basis points respectively. On a year-to-date basis, it’s up just 2.09%.
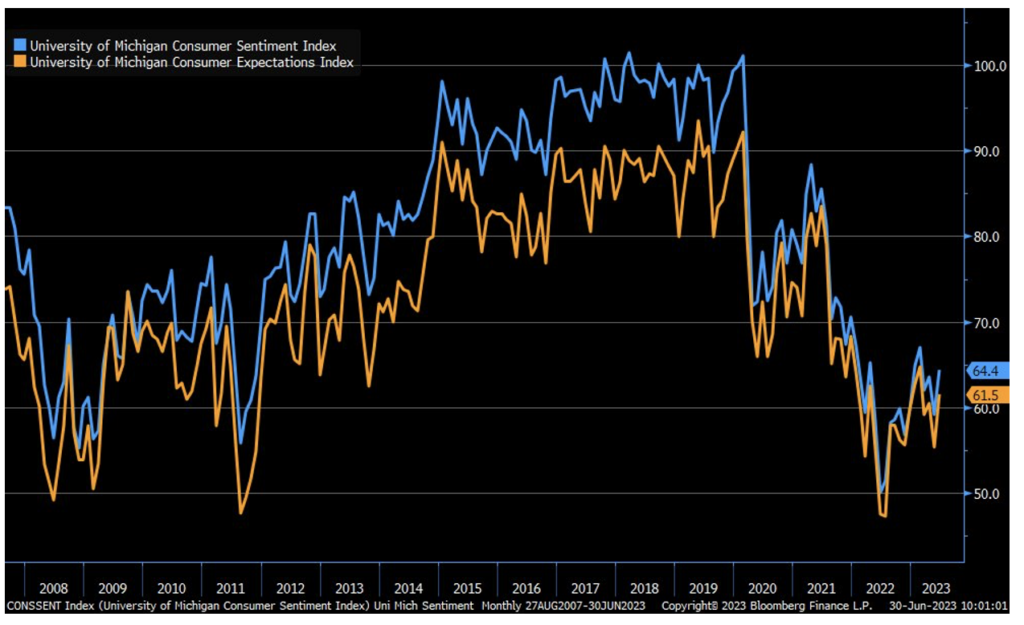
The US economy has been remarkably resilient despite interest rate rises. Friday, the University of Michigan Consumer Sentiment Index was revised upward to 64.4 from 63.3, the difference between the Blue and Orange Line. This compares to May’s report of 55.4.
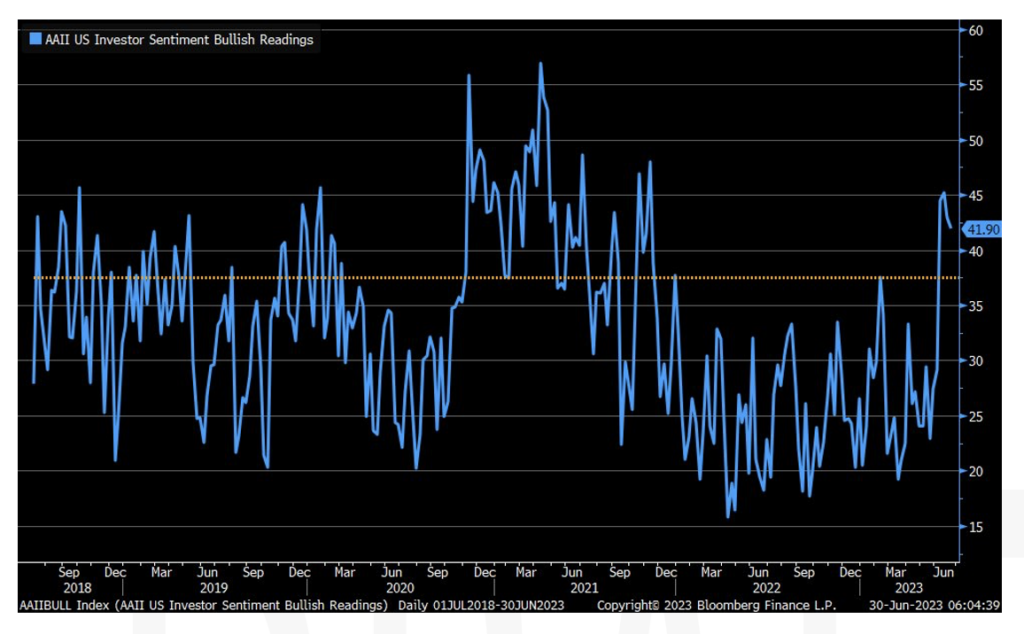
And while there was a slight decline, investors continue to be bullish above the historical average of 37.5% according to the most recent American Association of Individual Investors’ Stock Sentiment Survey.
The relative optimism stems from signs that inflation is abating. Friday’s release of the Personal Consumption Expenditure Price Index (PCE) came in at 3.8%, below consensus of 4.6%, and down from the previous month’s 4.3%. Core PCE is a key metric the Fed has telegraphed as being an indicator for determining the pace and severity of rate changes as it nets out food and energy. It also came in year-over-year below consensus, 4.6% versus 4.7%.
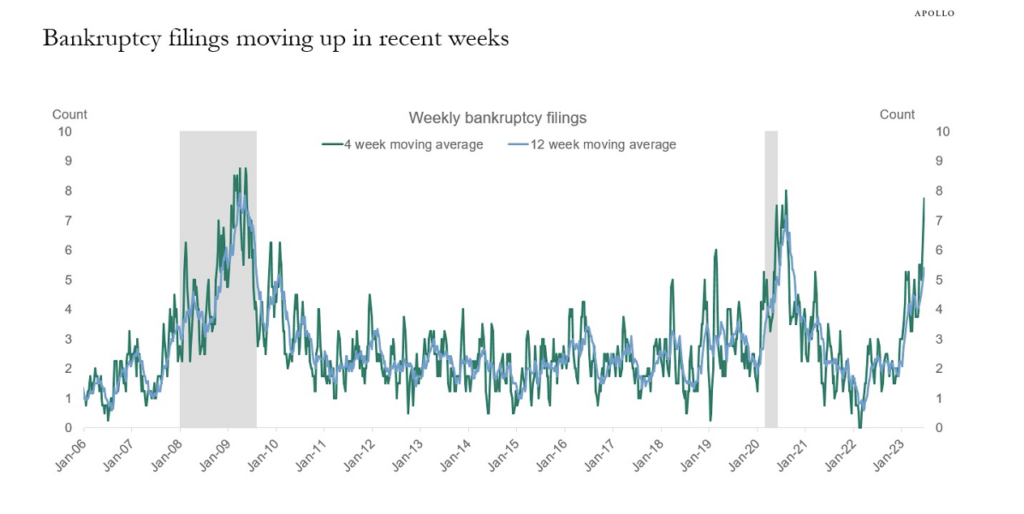
Rate increases, however, are starting to have some impact as noted in a recent analysis from Apollo.
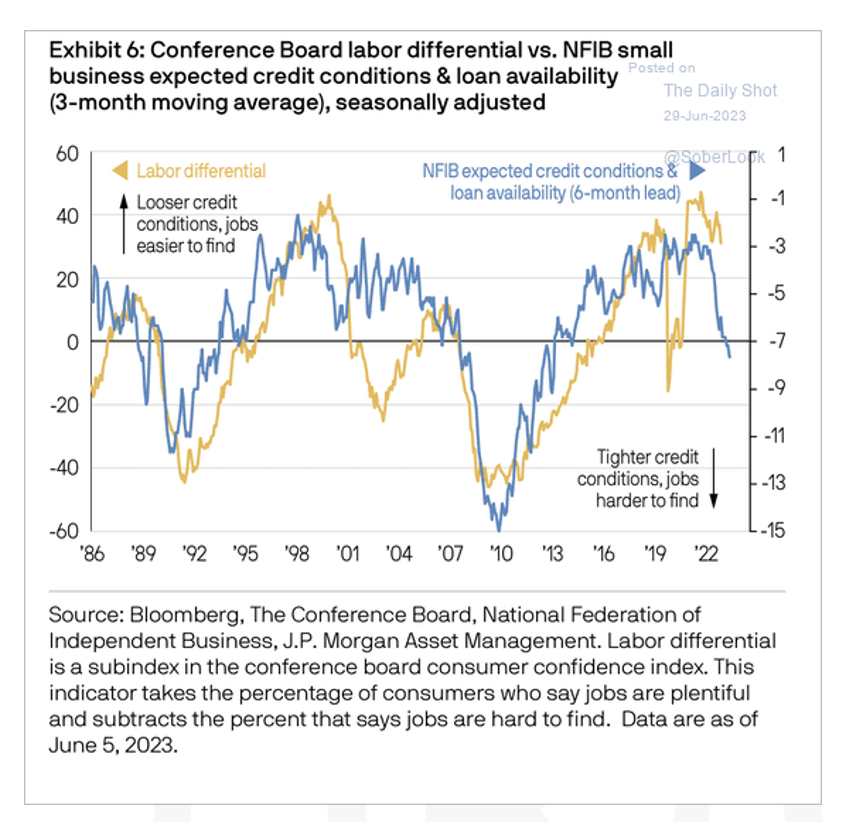
Higher rates and tighter credit conditions typically lead to higher rates of unemployment but this is one area that continues to remain strong. The US will report non-farm payroll data this coming Friday with the estimate job growth at 200,000 jobs. The unemployment rate is expected to be unchanged. Aside from the Personal Consumption Indicator, job and wage growth are key components that are guiding the Fed’s future rate decisions.
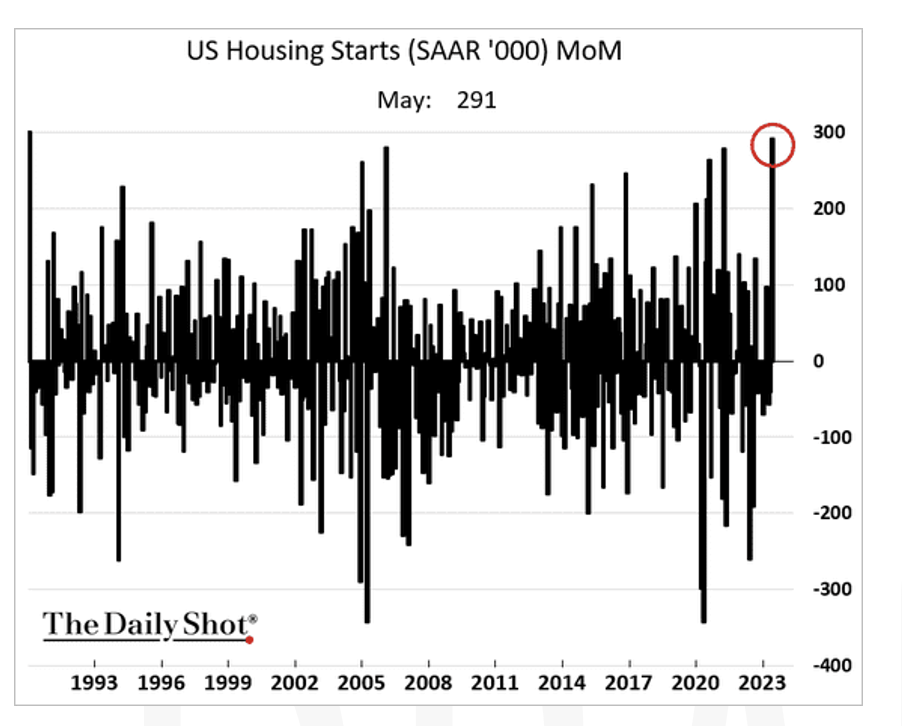
Additionally, higher rates and the speed of rate rises have changed the dynamics of the housing market. Sales of existing homes have slowed largely because sellers do not want to incur a higher rate on another home. However, demand for housing still exists. This has led to one of the highest housing start data in decades. Housing starts climbed in May to a seasonally adjusted rate of 1.6M, 22% higher than April.
Trading will likely be very light in the US as markets close early on July 3rd and are closed July 4th. Canadian markets are also closed on Monday. Despite the early closure in the US, the Institute of Supply Management (ISM) will release June Manufacturing Employment data. May’s data surprised on the upside. We will also see the Institute publish data on new orders and its Purchasing Managers Index (PMI) data for June. The index in based on a survey of over 400 industrial companies.
Equities
NASDAQ closed out the first half of 2023 with the best performance since 1983 when IBM was the biggest tech company and Apple was launching their desktop Lisa which was released on January 19th, 1983. For context, this was before Microsoft went public in 1986 and also the internet boom. A lot of the boom is due to cost savings from mass layoffs seen in 2022 by big tech companies that has boosted earnings in 2023 and is also sparking price increases, coupled with the AI surge. Names like NVIDIA (+189.46% YTD), META (+138.47% YTD), and Tesla (+112.51% YTD) all have returned north of 100% YTD which is astonishing as we think about the huge sell off in 2022, a banking crisis, and fears of a possible recession.
Following the positive PCE print this week major averages were positive. On the week gains in US indices were seen in the S&P 500 (+2.36), Russell 1000 (+2.51), and the Russell 2000 (+3.75) highlighting small caps had a slightly better bounce on the week. We saw a bit of a hiccup in the equity markets Wednesday following Jerome Powell’s comments but positive stress tests from major banks such as JP Morgan and Bank of America lifted US equity markets as the S&P 500 and Nasdaq both closed at 52-week highs. Every sector saw gains led by strengths in REITs, energy, industrials, materials, and technology. After finishing positive, NASDAQ has posted nine of the last 10 weeks with positive returns, S&P 500 posting six of seven weeks, and Dow Jones Industrial Average posting four of the last five weeks.
Top performing ETF categories for the week were energy (+3.3%), specialty real estate (+3.03%), blend-mid cap (+2.49%), specialty finance (+2.23%) and industrials (+2.18%). The worst performing ETF categories were mostly commodity related with agriculture (-4.68%) base metals (-3.20%) leading the way down. commodity blend (-2.69%), shorts (-2.58%) and specialty healthcare (-1.82%) also declined. Apple ended the day hitting a $3 trillion market cap making it the first company ever to do such a feat. Major cruise lines were the best performing stocks in Q2 not your typical tech names. Carnival (CCL), Royal Caribbean (RCL), and Norwegian Cruise Line (NCLH) are up an average of 61% in the second quarter. Cruise lines are seeing a rebound with occupancy rates surpassing 100% and above pre-pandemic levels.
Globally, Europe saw positive gains with the MSCI Europe posting a +2.10% return for the week following a slowing in Eurozone inflation data. France’s CAC 40 Index jumped +3.3%, Italy’s FTSE MIB rose +3.75%, Germany’s DAX increased 2.01% and the UK’s FTSE 100 index rose 0.93%. Investors have withdrawn a total of $27 billion from Europe’s stock funds this year with outflows occurring for the 16th consecutive week. During the previous week, Europe experienced the most substantial outflows among major regions with a staggering $4.6 billion exiting the market.
Japan stocks saw gains on the week with the Nikkei 225 Index posting a +1.2% return while the TOPIX returned +1.1%. Through the halfway mark of 2023 Japanese equities were one of the top performing countries in local currency terms.
Chinese stocks ended the week mixed following weaker than expected economic factors. China’s blue-chip CSI 300 Index ended the quarter down -5.1%, the Shanghai Composite Index dropped -2.2%, and Hong Kong’s Hang Seng Index ended the quarter -7.3%.
Fixed Income
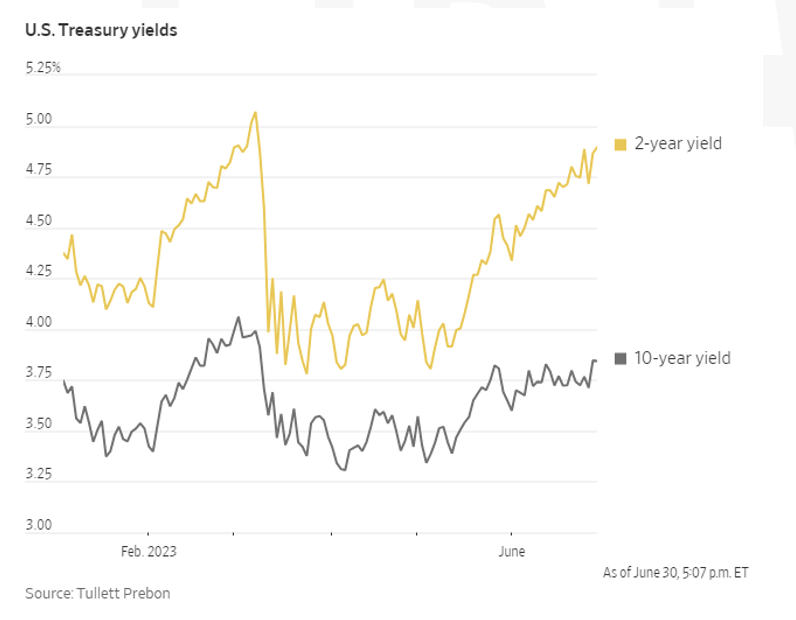
Yields rose across the curve to close out last week of June, with the 2-year Treasury yield rising 16 bps, the 10-year Treasury yield rising 7 bps, and the 30-year Treasury yield rising 3 bps. For the month of June yields rose, the 2-year Treasury yield rose 47 bps, the 10-year Treasury yield rose 17 bps, and the 30-year Treasury yield remained unchanged. Meanwhile, index returns were mixed. The Bloomberg US Aggregate Bond Index fell -0.26% for the week and closed out the month down -0.36%. The Bloomberg US Corporate High Yield Index rose 0.83% for the week, and finished the month up 1.67%, and the Bloomberg US MBS Index fell -0.45% for the week and closed the month down -0.43%.
Yields rose in Q2 on signs of strong economic data and waning stress in the banking sector. In early April yields soared as the regional banking crisis was working its way through economy. With recent data showing strong labor market metrics, and declining inflation, investors are hopeful that the Fed could conquer inflation without forcing the US economy into a recession.
Junk bond sales are rising as companies accept stricter terms to borrow money. Since the beginning of the year companies such as American Airlines and Six Flags have issued $91B in speculative bonds, a 35% increase from a year ago according to Pitchbook. Average maturity of junk debt has decreased to 6.1 years, down from an average of 7.4 years in the previous decade. The increase in bond issuances can be explained by a weak speculative grade loan market, as CLO’s have struggled this year due to rising costs. Speculative grade default rates are sitting at 3.07% as of last month, well below the level of 4.5% prior to the pandemic. Default rates reached a low of 1.22% in early 2022.
Further, regional banks and finance companies in the US are grappling with mounting challenges in funding and maintaining consumer loans prompting them to offload these loans at discounted rates. Consequently, private credit firms and hedge funds are experiencing a deluge of loan offerings encompassing car debt and personal loans from prominent consumer lenders. While this trend presents potential profit opportunities for hedge funds and investors, it is likely to translate into higher financing costs or diminished financing options for consumers. Smaller banks are also resorting to selling loans they had previously purchased.
Hedge Funds as of June 29th
This week was challenging for hedge funds (HF) in relative terms as the average global fund captured only a small portion of the MSCI World’s gains (+10 bps vs. index +1%). As for US-based long/short (L/S) equity funds, equity indices performed inversely to current positioning tilts (Russell 2000 outperformed Nasdaq by +3%), resulting in the cohort only posting gains of +30 bps vs. the S&P 500 increasing 1.1%. Also helping to explain the more challenging performance were the crowded names in North America (NA). The top 50 shorts in NA outperformed the longs by <3.3%, resulting in the worst spread for the crowded names since early February 2023 (when short momentum rallied). In other regions, performance was also challenging for European Union (EU)-based and Asia-based HFs as the crowded shorts in each region rallied more than longs (EU L/S spread: -1.2%; Asia L/S spread: -1.9%). EU funds and Asia funds’ returns were roughly flat vs. their respective benchmark indices posting gains of 80 bps and 24 bps, respectively. The de-grossing continued across global equities seen throughout most of June after taking a brief pause in the week prior. Similar to last week, most of the de-grossing was seen across NA and Asia ex-Japan equities. In NA, the flow was an even mix of long sells and short covers. What stood out the most from the NA de-grossing was early signs of HFs beginning to moderate their positional tilts to areas that were more crowded. On the long side, the selling was spread across most sectors (with the exception of industrials and financials), though it was largest in those pockets of the market where HFs have been ‘overweight’ throughout the year (including TMT, particularly mega-cap names, healthcare, and consumer staples). As for the covering, much of the flow was driven by index-level products in addition to areas with higher levels of short exposure, particularly consumer discretionary (specialty retail, autos, hotels, restaurants & leisure), financials (diversified banks, capital markets), and industrials (broad-based across most sub-sectors). As mentioned above, HFs also trimmed their exposure to Asia ex-Japan, with most of the gross reductions seen on the long side (short flow was more muted). The selling was concentrated within China, with all share types ultimately ending the week as being net sold (led by A-shares). Europe, on the other hand, was slightly net bought, with most of the buying attributable to long additions. At the sector level, the long buying was concentrated within EU financials (banks) and technology (semiconductors). The flow was muted in Japan where HFs added longs in healthcare and industrials in a relatively small amount.
Private Equity
According to a PitchBook analysis, the private equity (PE) industry is facing a significant decline in exits that could have a long-lasting impact on limited partner (LP) returns. The decline in US PE exit value, which began in late 2022 and continued into 2023, is even more severe than during the global financial crisis, resulting in an estimated $60 billion shortfall in deal value.
The report reveals that, apart from the market shock caused by the COVID-19 lockdowns in 2020, the current decline has led to the most substantial loss in exit value compared to long-term trends. An analysis of the past two decades suggests that since 2019, the market should have experienced approximately $60 billion more in exit value across 664 additional deals. The recent drop-off in deals drove this four-year shortfall.
The backlog in PE exits means less capital is returned to LPs, prolonging investment life cycles beyond expectations. This leads to lower fund performance compared to peers, as fund performance is closely tied to the amount of capital distributed to LPs. Even if exits were to bounce back in the near future, the impact of the drop-off is expected to negatively affect funds’ internal rates of return (IRR), a key metric used to measure fund performance.
Strategic buyers have become a popular choice for PE exits, comprising nearly 70% of acquirers of PE-backed companies in Q1. Other sponsors faced difficulties accessing debt, while the IPO market remained closed. Companies with available cash or pre-rate-hike credit facilities, such as WiseTech Global and Shell, were able to announce deals. However, overall PE exits in Q1 experienced a 34% drop in exit value and a 15% drop in exit count compared to the previous year.
Additionally, new PE investments also experienced a decline, with overall deal volume falling 9.3% in Q1 compared to the previous quarter. However, add-ons and PE growth deals outperformed long-term trends during the six-month period ending March 31, with higher deal values than usual.
Authors:
Jon Chesshire, Managing Director, Head of Research
Elisa Mailman, Managing Director, Head of Alternatives
Katie Fox, Managing Director
Michael McNamara, Analyst
Sam Morris, Analyst
Sam Friedberg, Summer Associate