
Economic Data and Market Highlights
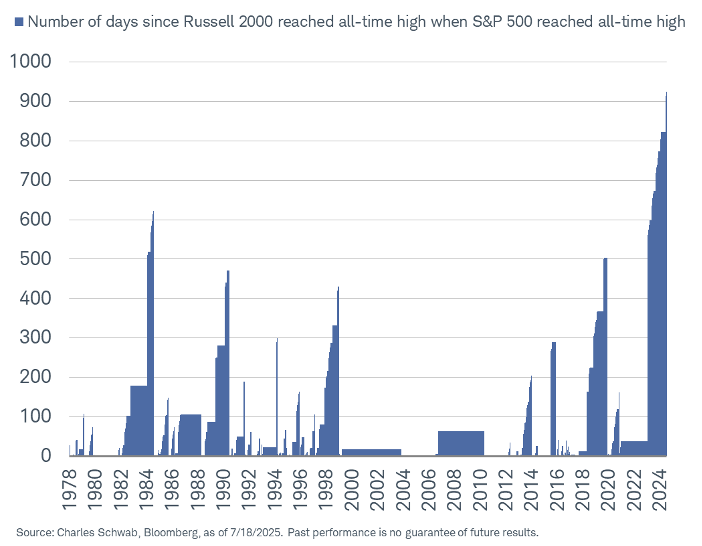
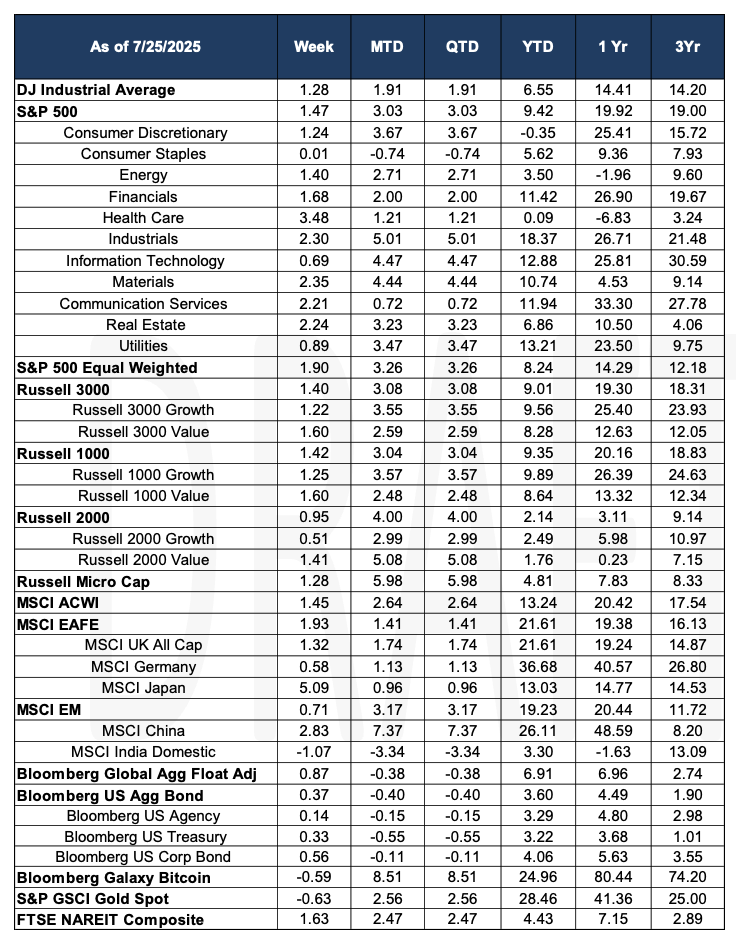
On Friday, the S&P 500 hit a new high, the ninth time this month, meanwhile the Russell 2000 has not hit an all-time high since November 8, 2021. The S&P 500 rose 1.47% for the week and is up 19.92% on a year-to-date basis. Developed market equities rose 1.93% and are up 19.38% year-to-date. The Russell 2000 has advanced 3.11%
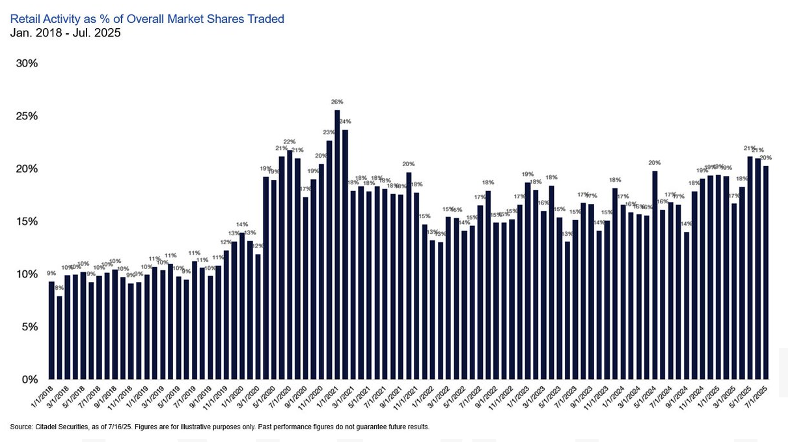
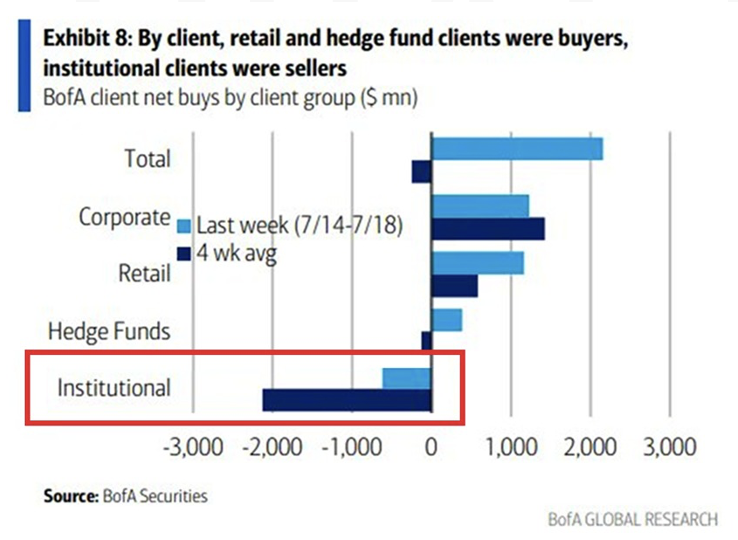
The rise of the S&P 500 and concentration of top names in that benchmark, 36.5% in the top 10, have gotten a significant amount of press. AI and its impact continue to dominate markets and business, but as valuations continue to become more excessive by historical standards, institutional investors seem to be taking a breather or are selling. The chart below was compiled by Citadel and indicates the amount of retail activity and share of trading activity, currently high by historical standards. Recent data compiled by Bank of America indicate that institutional players are net sellers while retail buyers and hedge funds are net buyers. They also note in a recent report that retail buyers have been net buyers in 30 of the last 32 weeks. For institutions, it represents 10 weeks out of the last 11 that they have been net sellers.
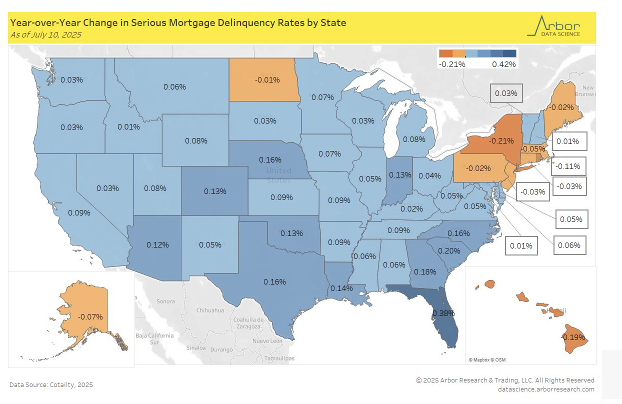
Delinquency rates saw the largest year-over-year increase in some states, mostly in the southeast while states in the northeast saw declines in the delinquencies. Delinquencies are defined as greater than 90 days past due.
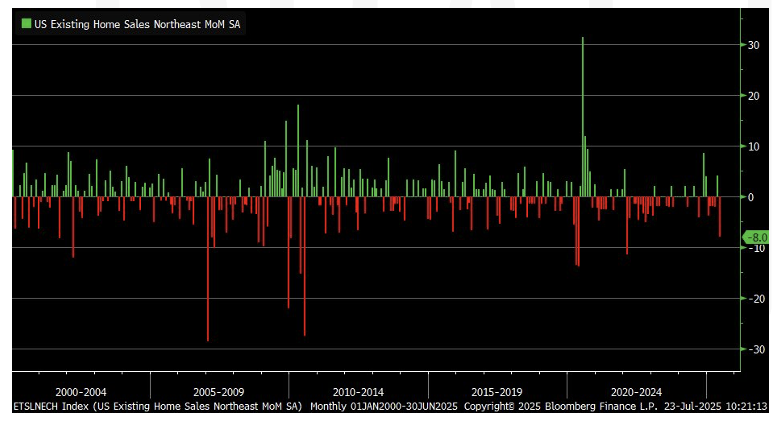
 Existing home sales in the northeast, however, saw declines of over 8%.
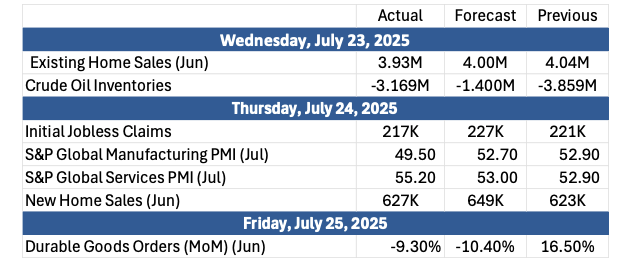
The Past Week’s Notable US data points (with revisions)
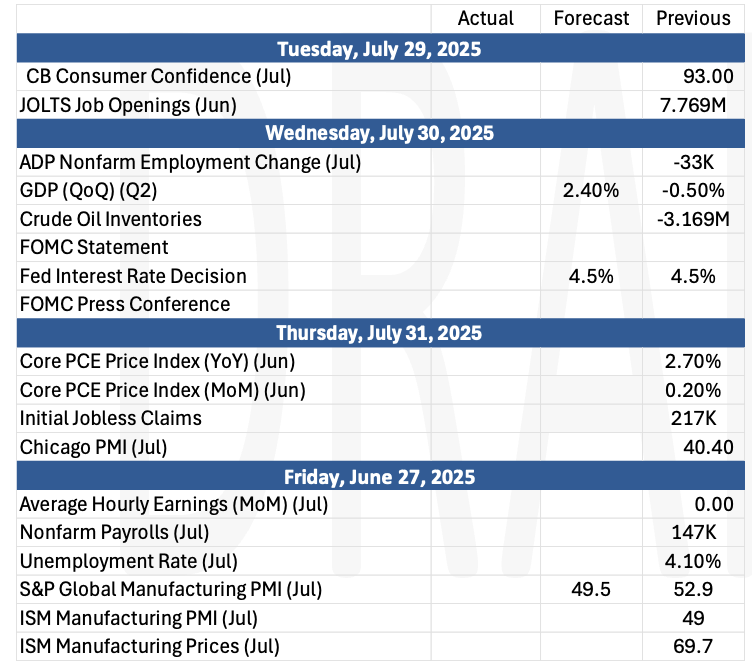
The Upcoming Week’s notable US data points
Source: Morningstar
Data Source: Jim Bianco Research, Charles Schwab and Co, Financial News London, Financial Times, Kobelessi Letter Morningstar, MarketWatch, Standard & Poor’s, and the Wall Street Journal.
Authors:
Jon Chesshire
Michael McNamara