
Economic Data Watch and Market Outlook
Security prices were mixed around the globe this past week. US equity markets rose while developed markets lost ground (S&P 500 up 70 bps and the MSCI EAFE down 57 bps). Emerging market equities lost the most ground, falling 1.31%. US bonds were virtually flat, as the Bloomberg US Aggregate Bond index rose just one basis point.
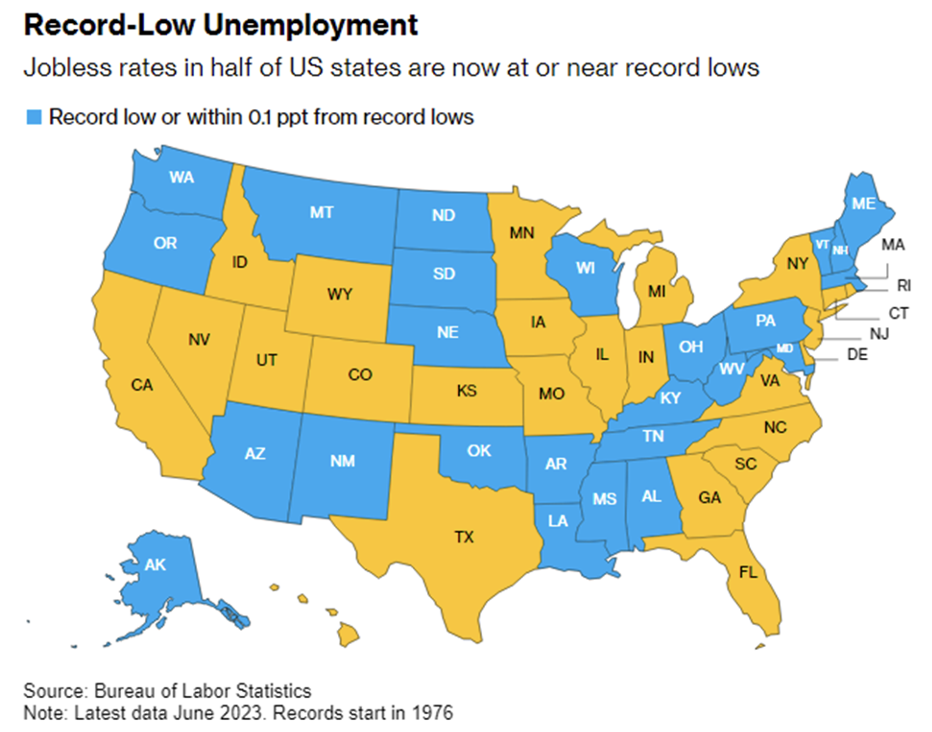
Initial jobless claims and continuing claims were positive to flat, with the initial claims coming in below expectations (228,000 versus 242, 000) but continuing claims were a slightly heavier than expected (1,754,000 versus 1,729,000). Half of US states saw record low unemployment rates in June. Unemployment rates in 25 states are currently at or close to 0.1% of a record low, with New Hampshire and South Dakota seeing the lowest unemployment rates at 1.8% in June. Meanwhile, California’s unemployment rate is up 0.7% to 4.6% from a year earlier, primarily driven by job cuts in the tech sector.
Housing starts in the US were released on July 19th and the month-over-month result was significantly lower than consensus, (-8.0% versus a forecast of +7.2%). However, it should be noted that the previous month’s housing starts increased almost 16%.
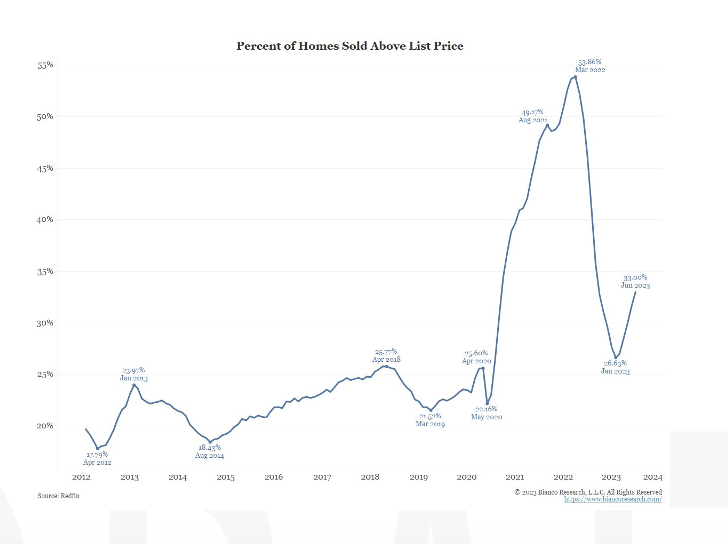
Mortgage rates ticked down from the previous week’s result to 6.87% from 7.07% according to the Mortgage Bankers Association and according to the same source, mortgage applications increased week-over-week by 1.1%. According to data compiled by
Redfin and Jim Bianco Research, the percentage of homes purchased above list price bottomed in January from the last peak in March 2022 when approximately 50% of homes sold above list price. As you can see from the chart below, that percentage has been increasing again. Now roughly 30% of homes are selling above list.
As we have noted in previous reports, consumer debt burdens and revolving debt rates have been increasing, as well as a wave of additional debt expected to soon hit the consumer. According to a report by Oxford Economics, the resumption of student loan payments in the US in October will lead to a reduction in consumer spending by up to $9 billion per month, or over $100 billion per year. This could potentially cause a decrease in gross domestic product growth by 0.1% in 2023 and 0.3% in 2024, increasing the chances of a recession. Many borrowers who have been on a three-year pause since March 2020 will struggle to cover their monthly bills, especially with rising housing costs and inflation. However, there is hope that the impact could be lessened by the excess of household savings resulting from student loan forbearance, with borrowers having saved a collective $87 billion through the second quarter of 2022, and an estimated additional $44 billion added during the first half of this year, according to the Federal Reserve and Oxford Economics projections.
As the record heat wave extended this past week across the US and Europe, with several days in a row being the hottest on record, Amazon (AMZN) has seen a significant increase in sales of products that help consumers beat the heat. Air conditioner sales are up 248% for the 30 days ending July 14th while sales for fans grew 60%. Another category seeing a big uplift in sales are air purifiers where units increased by 96% compared to June of last year due to the Canadian wildfires impacting the country. In the northeast specifically, sales jumped by 119% in June as residents of that region faced some of the worst air quality to date.
On a lighter note, Taylor Swift’s Eras tour has been widely and wildly successful as many cities around the US noted how much a stop in their city has boosted tourism with most noting that, without Taylor’s concert, tourism has been declining in recent months. This update would have likely not have been included in this weekly update had the tour not been noted for its impact in the recently released Philadelphia Fed’s Beige Book report stating “Despite the slowing recovery in tourism in the region overall, one contact highlighted that May was the strongest month for hotel revenue in Philadelphia since the onset of the pandemic, in large part due to an influx of guests for the Taylor Swift concerts in the city.”
Equities
Despite declines late in the week, domestic equities were mostly positive for the week. Per a survey conducted by Vanguard Investors in June, investors are at their most bullish since the start of 2022.
Apple (AAPL) has developed its own AI model, AJAX, and used it to build their own chatbot called “Apple GPT”. The company has not decided how and when to release it to consumers, but Apple’s stock price jumped to a record high following the news.
Tesla (TSLA) shares fell 4% in extended trading Wednesday after the company posted Q2 earnings. The report showed the aggressive price cut hurt profitability despite recording record revenues and deliveries. Operating margins declined 9.6% due to stated price cuts while the EV maker posted a record $25 billion in revenue. In other electric vehicle news, India has rejected Chinese automaker BYD Co’s proposal to invest $1B in electric car and battery manufacturing in a partnership with a local Indian company. Furthering the idea that India is turning inward to supplement growth.
TSMC reported its first earnings decline in four years Thursday expecting sales to fall 10% by 2023’s year end. Semiconductor manufacturers are beginning to be impacted by the slowing demand of smart phones which are down roughly 11% in 2022 from the previous year. TSMC reported softening consumer demand, rising costs, and a shortage of various skilled workers reflecting those concerns are impacting the chip making space. The decline in its stock priced also negatively affected the MSCI Emerging Markets index. As noted above, the benchmark fell 1.31% for the week. Of the 1,243 holdings in the benchmark, TSMC amounting to 6.38% as of Friday’s close.
On Thursday the Dow Jones Industrial Average posted its longest winning streak, 10 consecutive days, since August 2017. The S&P 500 and NASDAQ both saw negative returns on the same day following the post-earnings sale in Tesla shares. Netflix was another tech stock that added to those declines as it fell 8.4% on the day after it reported revenue fell short of expectations despite adding 5.9 million subscribers. Roughly 15% of companies in the S&P 500 have reported fourth-quarter results and 74% have exceeded analysts’ consensus on earnings estimates, which is below the five-year average of 77%. The week of July 24th is a big one as some of the largest tech names are set to report earnings in the US such as Alphabet, Microsoft, and Meta Platforms.
Fixed Income
The two-year Treasury yield rose eight bps to 4.82% this week, while the 10-year Treasury yield inched up 1 bp to 3.84%, and the 30-year Treasury yield slipped two bps to 3.91%. Meanwhile major bond indices remained relatively flat. The Bloomberg US Aggregate Bond Index rose only 0.01%, while the Bloomberg US Corporate High Yield Index rose 0.10%, and the Bloomberg US MBS Index fell 0.10%. The relatively calm week can probably be attributed to the upcoming Federal Reserve Policy announcement on Wednesday the 26th. Fed funds futures traders looking to the the CME Fed Watch tool which is showing nearly a 100% probability that a 25bps hike will be announced, which will raise the fed funds target rate to 5.25%-5.5%.
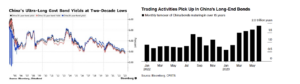 China’s ultra-long government bonds are seeing an uptick in demand as the economy’s lower than expected growth rates further bets on gains in the sector. The yields on 15 and 20-year government bonds fell to their lowest levels since 2002 this week, with 30-year yields falling to levels last seen in 2005. Slower than expected economic growth data induced a number of forecast downgrades at banks such as JPMorgan and Morgan Stanley. Expectations that the Chinese government will tolerate slower growth in exchange for lower inflation spurred on the rally in long term bonds. Transaction volume has risen to a multi-year high, with turnover of cash bond trading on notes over 15 years reaching 1.9T yuan in June – the highest level since July 2020, and over double the monthly average of 2022.

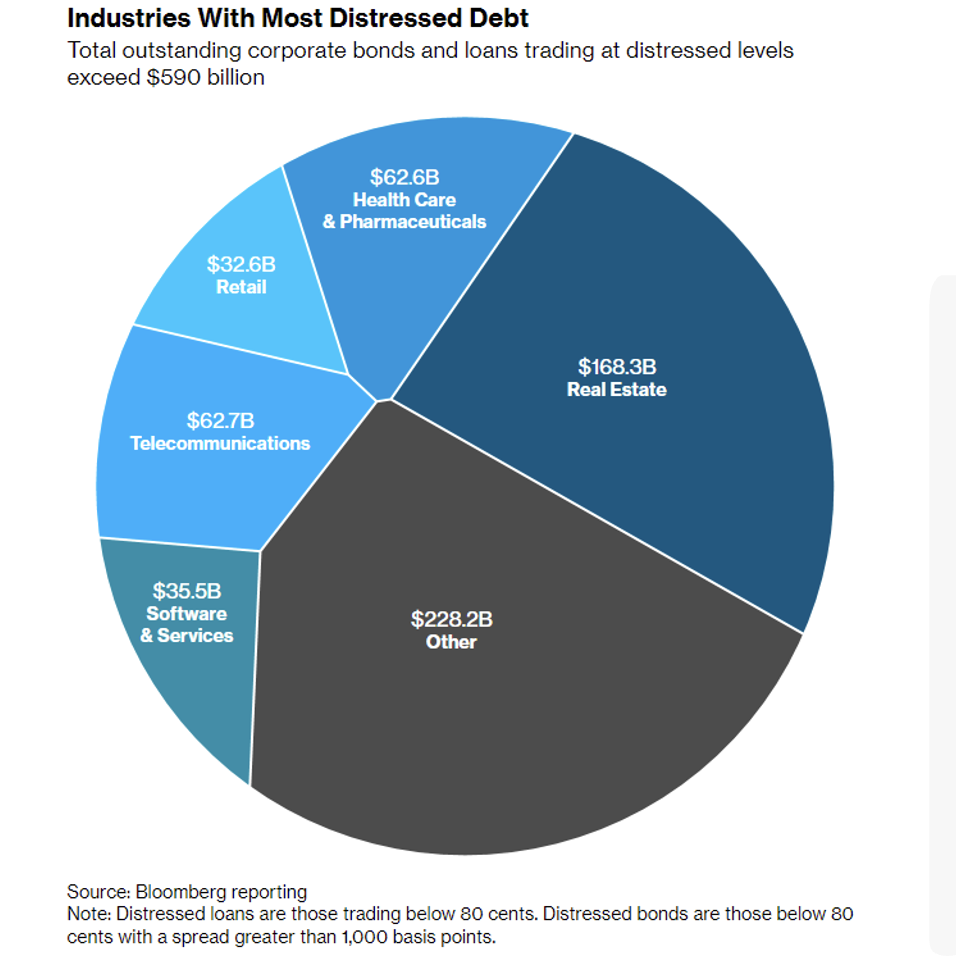
Corporate debt continues to be an area of concern for the global economy. Total outstanding corporate bonds and loans trading at distressed levels now exceeds $590B. Since 2008 the amount of high-yield bonds and leveraged loans has more than doubled to $3T in 2021. Over the same period, debts of non-financial Chinese companies surged and in Europe, junk bond sales jumped over 40% in 2021. In the US, distressed bond and loan levels have surged 360% since 2021.
Hedge Funds As of Thursday July 20th
A choppy week across equity markets globally left the average global fund down slightly whereas the MSCI World posted small gains (average hedge fund (HF) -16 bps vs. index +25 bps). As for Americas-based long/short (L/S) equity, the group ended relatively flat on the week (-10 bps), which compares to the S&P 500 up +65 bps. Fundamental L/S managers started experiencing meaningful deterioration in short side alpha around late June and the trend has worsened so far in July. Europe-based HFs were also more-or-less flat on the week vs. the Euro STOXX 600 posting small gains of ~70 bps. Asia-based funds were the most challenged this past week, in absolute performance, with the average fund and average equity L/S fund in Asia posting losses of ~1% and ~1.2% respectively vs. the index also down 1.0%. This can possibly be explained as crowded longs in Asia underperformed their respective benchmark by nearly ~2%.
HFs continued to increase their directional exposure to global equities as they were net buyers for the fourth consecutive week. However, the net buying was entirely a product of HFs covering shorts (the largest since November 2022) whereas longs continued to be sold on a net basis (the gross reductions were broad-based across most regions). Looking first at North America (NA), the pace of de-grossing that began to accelerate in late June continued into this past week. There were only a handful of single-name sectors where there was any directionality to the flow, with communications services, consumer discretionary, and energy ending the week having been net bought (only sectors to see longs adds on a net basis). Flows to other sectors were flat (long sells and short covers offset one another in the remaining sectors). Regarding the long selling, L/S funds again were large contributors to the reductions in exposure, with the majority of what they sold concentrated in those same areas they’ve been positioned underweight (financials and industrials). However, tech longs were sold (semis, IT services), which was the first time this sector had any meaningful selling since the start of June. On the short side HFs continued to unwind index-level shorts, accounting for ~35% of the total covering, in addition to covering those pockets of the market with higher short exposure (banks, capital markets, software, tech hardware). Similar to NA, the flow to European equities tilted towards net buying as HFs covered more shorts than they sold longs with most sectors within the region ending net bought. This was led by EU Financials (capital markets) and healthcare (biotech). The opposite was true in Asia where the long selling outweighed the covering in Asia ex-Japan, resulting in HFs being net sellers of the region. China accounted for the bulk of the net selling, led by ADRs and A-shares. The flow was more paired off in Japanese equities where HFs trimmed longs in tech and financials and covered industrial shorts.
Private Equity
Private equity firms in the US are facing challenges as they continue to mark down the value of their portfolios in the second half of 2023. Despite a bull run in public markets, US PE firms are experiencing persistent financing difficulties and limited exit opportunities, leading to a slow campaign of markdowns.
In Q1 2023, the six largest public PE managers reported a median quarterly return of 2.4%, falling behind the S&P 500 by 5.1 percentage points. While PE funds had shown record-breaking outperformance relative to public markets from Q2 2020 to Q2 2022, they began marking down portfolios in the latter half of 2022. The markdowns are seen as an attempt to catch up with the current lower valuations compared to 2021. PE managers often anchor their perceived intrinsic valuations of portfolio companies, contributing to the delayed process of markdowns.
PE’s underperformance, however, has been relatively small compared to the significant valuation increases seen between Q2 2020 and the end of 2021. The dip in PE performance is mitigated by a public market rebound, leading PE managers to mark down their valuations more conservatively than initially expected.
The challenges faced by PE firms include higher financing costs, limited access to credit, and a sluggish IPO market. As a result, PE firms are holding onto assets longer in anticipation of more favorable economic conditions. This has led to a decrease in the exit-to-investment ratio, limiting chances to markup portfolios through realized returns.
Pitchbook analysts expect the performance gap between PE funds and public equities to persist into the second half of 2023, with fund returns likely to be flat by the year’s end. The extent of PE’s markdowns will depend on the Federal Reserve’s policy decisions, and a shift to quantitative easing could help reduce interest rates and improve credit conditions.
Authors:
Jon Chesshire, Managing Director, Head of Research
Elisa Mailman, Managing Director, Head of Alternatives
Katie Fox, Managing Director
Michael McNamara, Analyst
Sam Morris, Analyst
Josh Friedberg, Summer Associate
Data Source: Apollo, Barron’s, Bloomberg, BBC, Charles Schwab, CNBC, the Daily Shot HFR (returns have a two-day lag), Goldman Sachs, Jim Bianco Research, J.P. Morgan, Market Watch, Morningstar, Morgan Stanley. Pitchbook, Standard & Poor’s and the Wall Street Journal.