
Economic Data Watch and Market Outlook
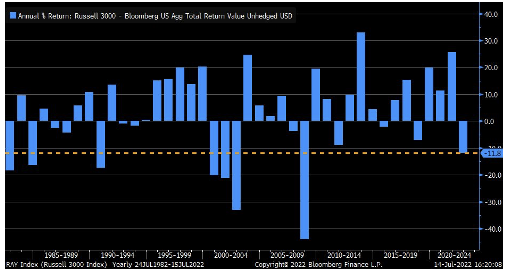
Equity asset prices sank 1.33% on the week as indicated by the MSCI World Index with the S&P 500 dropping 91 basis points and the MSCI EAFE falling 175 basis points. Emerging market equities fell 369 basis points on the week as the Dollar continued to surge. US Bonds (the Bloomberg Agg Bond Index) jumped 89 basis points. While the markets did show a decline on the week, the weekly returns fail to show the volatility that occurred on Wednesday, Thursday and Friday. The market dropped as much as 3.6% from the previous week’s close after an unexpectedly high 9.1% CPI result was released. Market speculators suggested a potential for rate cuts in September only to reverse course and suggest a 1% Fed Funds hike in July. When this news was digested, the markets surged back on Thursday and Friday, likely a result of Core PPI being slightly lets month over month than forecast (0.4% vs 0.5% est.). Further on Friday, the Core Retail Sales number came in at 1% month over month versus a 0.6% estimate. We expect volatility to continue until there is more clarity around the direction of the Fed. Looking back this has been the worst year for stocks versus bonds since 2008.
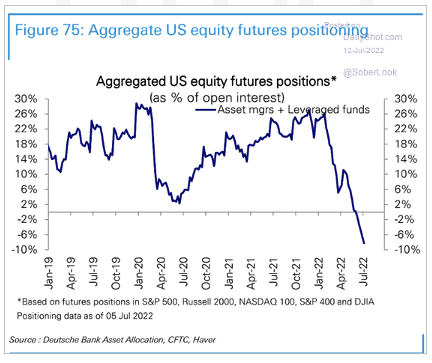
In Investment Committee meetings over the last few weeks we have focused potential changes in our allocation. We will likely see management teams take the opportunity, as they did in 2Q of 2020, to posture future earnings guidance allowing for COVID to contribute to poor short-term results. We may be seeing this as future guidance is starting to be delivered with some companies stating they hired too quickly or too many people in ’21. We haven’t gotten full guidance yet but like other downturns, equity markets tend to overshoot in the short-term.
Perhaps the chart below represents short-term thinking and capitalizing on both negative economic data and light trading volume but hedge funds in aggregate seem to be positioned for future downward guidance.
This past week was notable on the geopolitical front as President Biden met the Saudis to discuss oil production. While gas prices have declined in recent weeks, with the average prices at the time of this writing at $4.53 per gallon, the US Administration continues to look for new sources. The meeting also shed light on the status of the US/Saudi relationship that it still is fractured over human rights issues. This upcoming week we will get data on crude inventories and imports, gasoline production and refinery production rates. We’ll also learn more regarding the Nord Stream 1 which supplies gas to Europe and has been offline for “maintenance”.
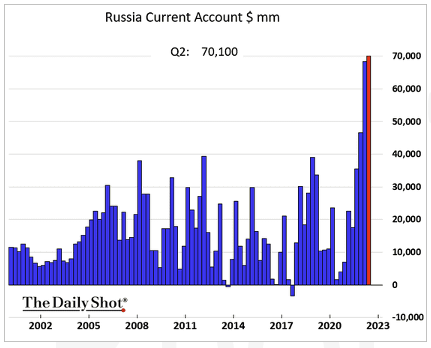
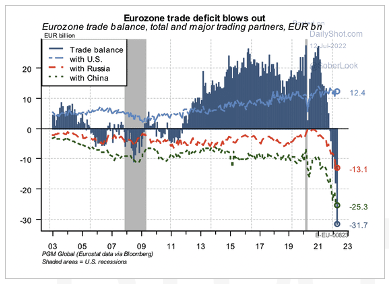
Russia continues to sell crude in global markets at a discount with notable producers such as Saudi Arabia buying it and reselling while taking their own production offline. As a result, Russia’s current account has grown significantly.
This has blown out the Eurozone’s trade deficit and consensus estimates for economic growth have plunged as a result.
This upcoming week will be light for economic data. In addition to Commodity data, we’ll see weekly mortgage data and jobless claims. Initial claims are expected to be 240k.
Equities
US Equity indices ended flat for the week with volatility created from reported CPI and 2nd quarter earning misses from JPMorgan, Morgan Stanley and Wells Fargo. The high CPI, which rose 9.1% year over year helped create the market volatility but also added to the speculation that the Fed would raise rates by 100 bps.
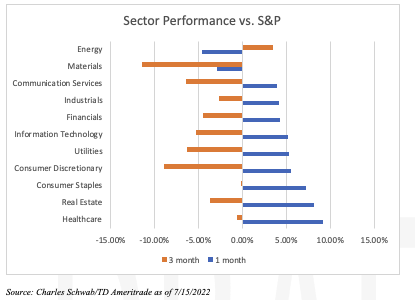
Despite the volatility, US Sector performance versus the S&P seems to be improving when you view it from a 1-month vs 3-month perspective, though the uncertainty of the Fed actions for the July 26/27th meeting may reverse the 1-month gains.
The Asian markets were down for the week due to COVID shutdowns and potential future shutdowns in China as an uptick of cases are showing in other parts of China.
Fixed Income
On the heels of the CPI release, yields across the curve originally spiked but have come down from week highs to end the week with the yield on the 2-year Treasury peaking around 3.2%. The movement in the 2-year Treasury, jumping 10 basis points following the CPI release, reflects market expectations for a more aggressive Fed come the next meeting set for July. The movement in longer-term bonds had the inverse reaction following the CPI release, originally spiking abruptly above 3% but falling back below 3% where it has been since the beginning of the week. If inflation continues to hit record highs, we can expect the Fed to take an aggressive stance on monetary policy, increasing the probability of a recession, which will drive down bond yields. The current curve inversion between the 2- and 10-year Treasury has been a concerning one, but some see a more worrying inversion that would be a more concerning one to signal a recession to follow: the 3-month Treasury bill and the 10-year Treasury note. The 3-month Treasury bill has been on a tear as the yield has been as high as 2.44% this week to fall to levels more around mid 2.3% as of Friday. This still has a way to go but, only makes for an argument to store short-term cash in a 3-month Treasury bill to capture some type of yield instead of just holding cash as the market looks to gain some sort of footing. When the 3-month Treasury and the 10-year Treasury inverts a recession has followed historically just under 2 years following the inversion. On a positive note, the S&P 500 gained an average return of 17% in the 12 months following the inversion and the Nasdaq saw a 20% gain on average during that same time span.
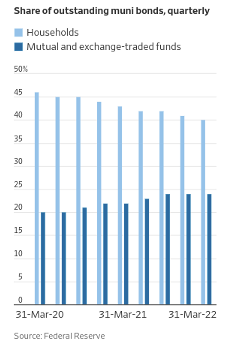
The Municipal bond market has seen some volatility this year due to asset managers buying into the market which was historically dominated by retail investors. The share of the market held by retail investors fell to 40% in the beginning of the year down from 46% in 2020. The shift has been seen from direct ownership of bonds to ownership through funds. Mutual and exchange traded funds controlled 24% of the Muni market in the first quarter of 2022 vs 20% in 2020. Bond funds have seen money inflowing in recent weeks with last week seeing a $7.8 billion inflow according to Bank of America, which is the largest inflow in 2 months. This comes as real returns on bonds are now achievable, which calls for investors to reconsider their allocations of their portfolio. It might not get as high as the historical allocation of 60/40, but it looks like a safe place for worrisome investors looking for some return in the near term.
Hedge Funds
This week was challenging for hedge funds as crowded longs in all 3 regions fell > 3% (NA -5.2%, Asia -4.2% and Europe -3.3%). Offsetting a bit of the pain was short alpha generated in all regions as Europe was the only region with a positive spread between crowded longs and crowded shorts. Hedge fund trading volumes were extremely light, one of the lightest YTD. Despite this, there was a notable tilt towards selling global equities with longs trimmed in all regions. In NA, the long selling equated to short additions, leaving gross exposure unchanged while net leverage fell to a level just shy of recent lows (~40%). Utilities have been net sold for the past 9 of 10 weeks after being one of the most net bought sectors through April. Hedge funds were also large net sellers of consumer-related sectors and tech (IT services and software – these 2 subsectors had the most long additions in June). In Europe, 9 of 11 sectors plus ETFs were net sold (except utilities and materials). Hedge funds were net sellers in both AxJ and Japan with gross exposure trimmed in both regions. In AxJ, the selling was driven by long sales in China A-shares.
Private Equity
Analysts suspect the European venture secondaries market to grow considerably given the lack of attractive exit options in the current volatile market and the increased need for liquidity. Europe is seeing a significantly reduced desire for venture-backed exits. As of June 2022, 463 deals have been completed this year worth an aggregate of $16.7M USD, roughly a 61% decrease in deal count and 88% in total deal value from 2021.
The global venture secondaries volume is expected to reach $138 billion by 2023. As Europe’s venture ecosystem continues to grow and mature, venture backed companies are staying private for longer making secondaries more appealing. Currently, direct company secondaries account for the majority of Europe’s secondary market; meaning founders, employees, and early investors sell a portion of their shares. Typically, direct company secondaries involve the sale of common stock with limited voting rights and less favorable liquidation terms than the preferred stock in the case of a liquidation event. Given common stockholders are the last paid in a liquidation event, buyers are typically compensated for this increased risk by doing the deal at a discount.
Typically, secondary valuations follow the primary market. As valuations decrease and the market remains volatile, analysts believe corporate venture capital firms, in particular will be looking to sell investments as their parent companies face a possible recession.
Data Source: Bloomberg, BBC, Charles Schwab, CNBC, the Daily Shot HFR (returns have a two-day lag), Jim Bianco Research, Market Watch, Morningstar, Pitchbook, Standard & Poor’s, the Wall Street Journal, Morgan Stanley, Goldman Sachs and IR+M