
Economic Data Watch and Market Outlook
Global Equity prices declined over 2.1% for the week while US Bonds rose 89 basis points. Inflation ticked up slightly above expectations as the Core CPI reported on Wednesday rose 0.6% (the market was expecting a 0.2% month over month rise). Consensus opinion is that the Fed is behind the curve in terms of its efforts to control inflation. The Fed’s language became sterner and seemed to change course as San Francisco Fed President Mary Daly, indicated that while “not a primary consideration” she did not rule out a 75 basis point increase in the Fed Funds Rate. She also noted a 50 basis point increase is all but certain at the next two meetings. During a May 12th radio interview
(https://www.marketplace.org/2022/05/12/fed-chair-jerome-powell-controlling-inflation-will-include-some-pain/ ), Fed Chair Powell indicated that a soft landing is not entirely in the Fed’s control. In addition to actually adjusting rates, the Fed can put pressure on rates by press conferences such as these, which cause market reaction, and by the continued unwinding of its balance sheet in the open market.
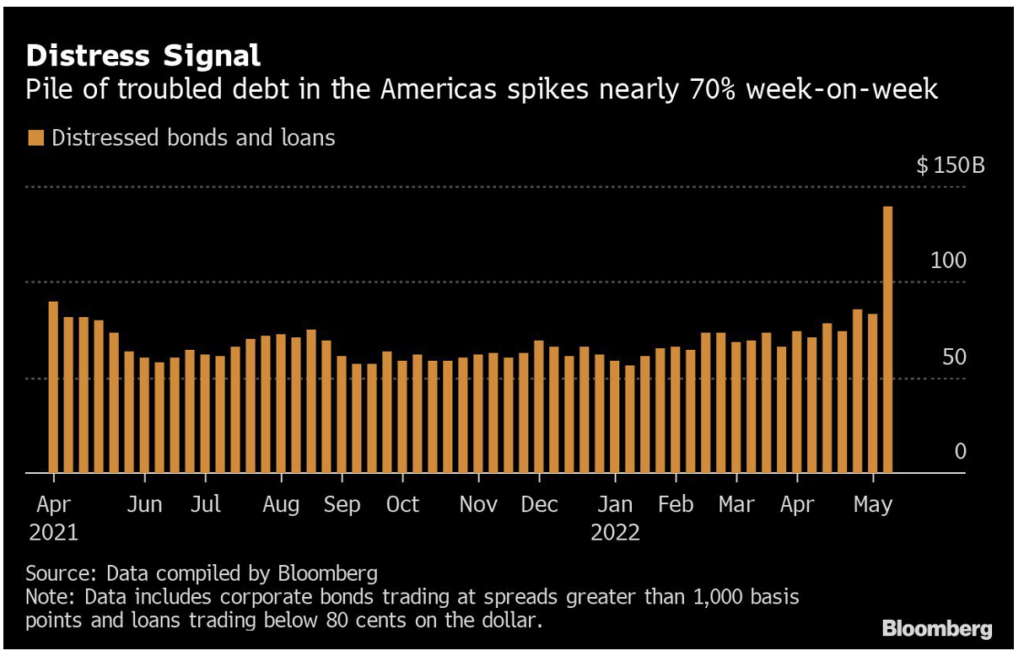
It is also clear that the Fed will allow the market volatility to continue and a “Fed Put” is no longer part of the Fed’s vernacular. While the economy is still robust in many areas, the term “layoffs” are starting to be used more frequently especially in the Tech space as companies become more focused on cash flow. We’ve also started to see spreads widen in some areas of the distressed market as evidenced in the chart below.
Despite the Biden Administration opening the strategic oil reserves as an attempt to alleviate high gas prices, a gallon of gas hit their highest levels in most areas of the US. The price per gallon stood at $4.47 according to data supplied by AAA. The American Petroleum Institute reported that US Crude Oil stocks declined by 1.6 million barrels in April.
Crypto markets had a significant meltdown during the week as “Stable Coin” Luna fell from $1.00 to near zero. The token used Bitcoin as collateral and put it under a significant amount of pressure as well. The price of Bitcoin trades under $30,000, significantly below the $69,000 high reached in November.
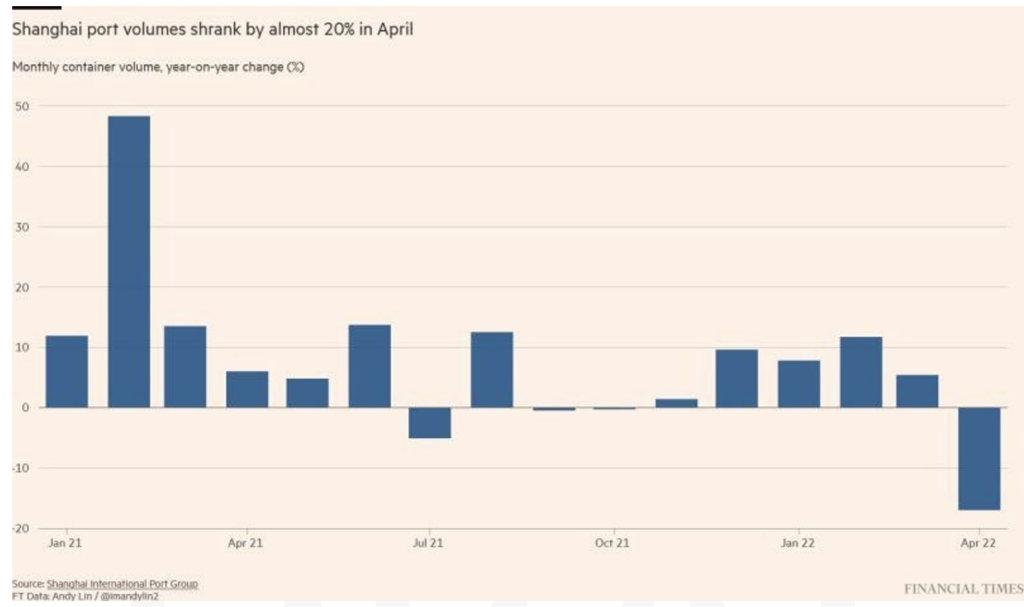
Supply chain issues due to COVID may still be evident in the coming weeks. While China did have several holidays during April, the more likely cause of port volume decreases, and a significant one at that, is the ZERO Tolerance COVID Policy restrictions currently creating backlogs. The question is are these really COVID related or more political centric actions as Chinese citizens have begun to question the current regime.
We fully expect volatility in asset prices to continue. If your or your entity’s circumstances have changed it is best to re-evaluate your investment policy statement, your contribution rates, or your withdrawal rates. If nothing has changed, it’s best to stay the course.
Equities
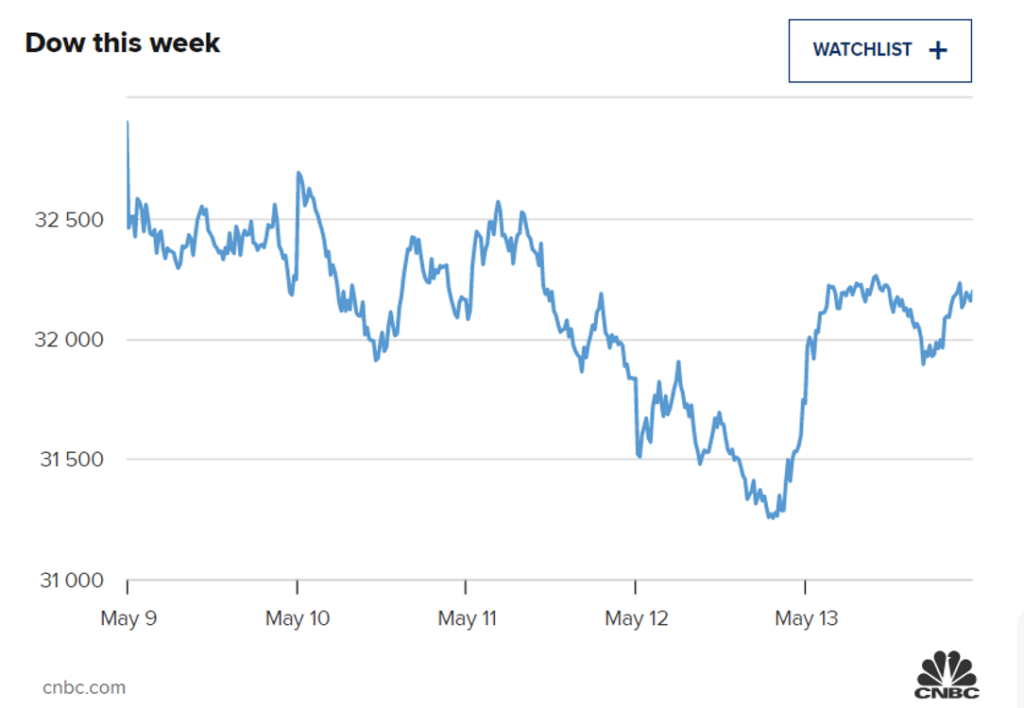
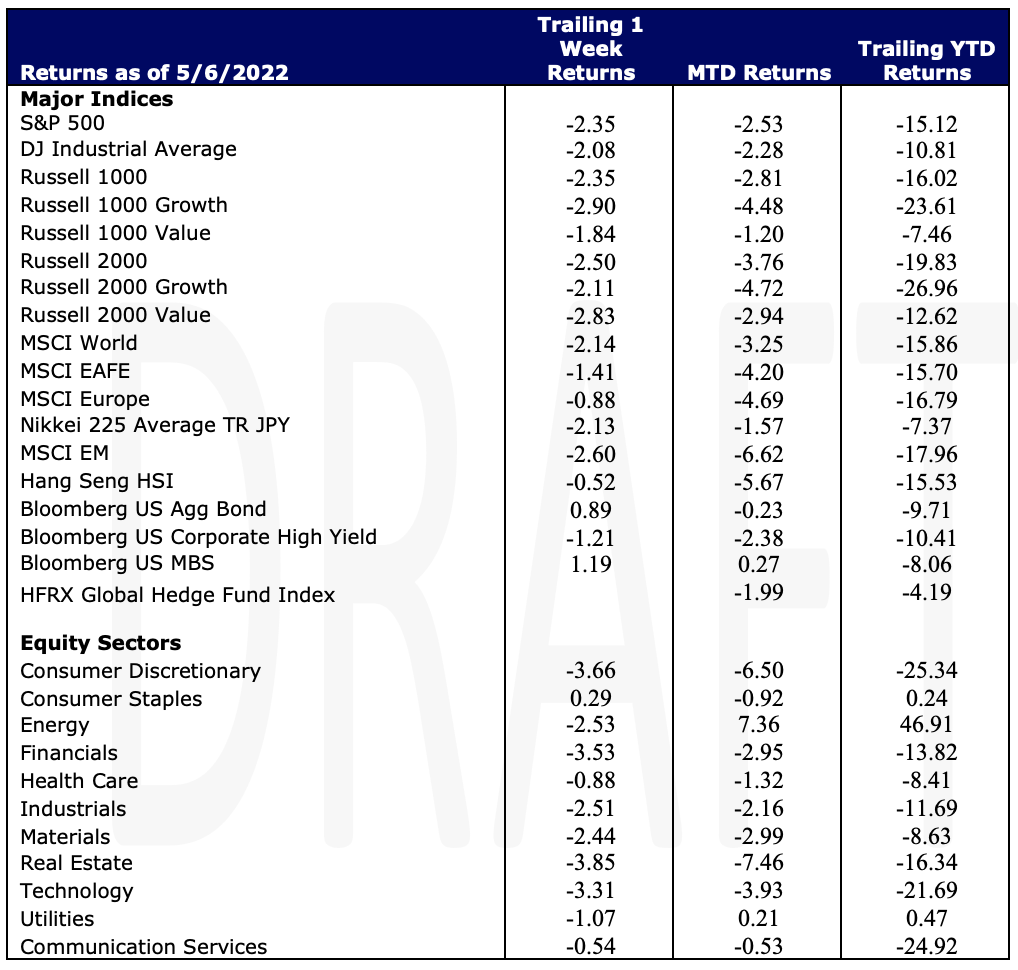
U.S Equity indices continue to be volatile. After a rocky start to the week, indices ended higher, albeit posting losses for the sixth consecutive week. Aggressive Fed monetary policy and slowing economic growth continue to grapple investors however Fed Chair Jerome Powell did reassure that bigger rate hikes are off the table for now even after the release of recent inflation readings. The S&P slid 2.4% this week – down 19.5% YTD, as of Thursday, and heading into bear market territory – defined as down 20% or more from its prior high, while the Dow Jones fell more than 2% and raked in its seventh straight week of losses.
The tech-heavy Nasdaq dropped 2.8% on the week, but posted its best one-day gain since November 2020 on Friday helped by a rally in giants such as Apple, Microsoft, and Amazon. More than 33% of listed NASDAQ stocks have hit their 52-week low in recent weeks. All 11 S&P sectors also ended the day higher on Friday albeit 10 of 11 sectors posted losses on the week. Real Estate -3.85%, Consumer Discretionary -3.66%, and Financials -3.53% led the losses this week while Consumer Staples 0.29% was the only sector coming in positive this week. Twitter was in focus after Elon Musk tweeted his $44 billion deal to acquire the social media company is temporarily on hold pending details around spam and fake twitter accounts – Musk also said he is still committed to an acquisition. Shares plunged 9.7%.
With Apple’s drop this week, it was surpassed by Saudi Aramco in terms of market cap. Saudi Aramco’s earnings jumped 82% in the first quarter as oil prices have surged.
Large-cap growth stocks declined -2.9% while small-cap growth stocks reported a slightly smaller loss of -2.11%. The large-cap Value stocks in the Russell 1000 Value outperformed the others posting a loss of -1.84% on the week while small-cap Value stocks slid 2.5%. On Thursday, shares of the Russell 1000 Value entered oversold territory, selling for as low as $149.56 per share. Oversold territory is defined as a reading below 30 on the Relative Strength Index on a scale of zero to 100 – in this case the RSI reading has reached 29.5 – a good starting point for bullish investors looking to make an entry. Globally, stocks slid as the MSCI World fell -2.14% while Emerging markets also declined -2.60% on the week.
Fixed Income
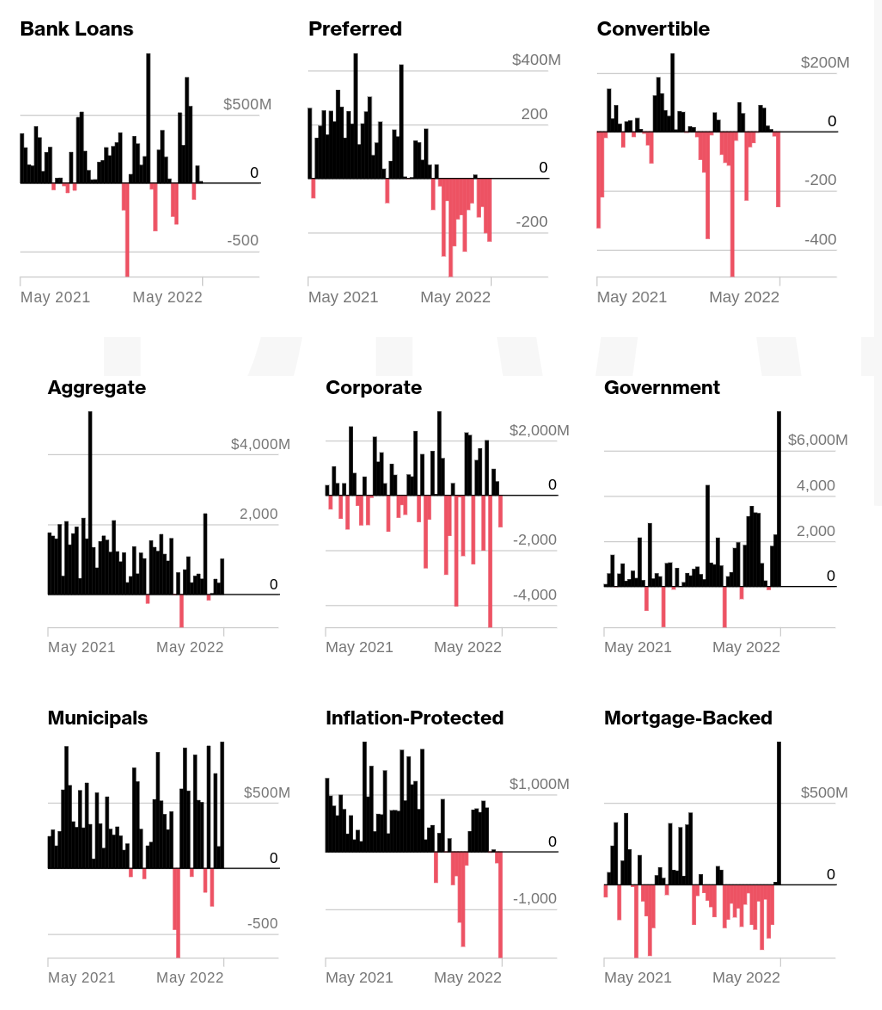
Treasury yields fell on the week across the curve with the 2-year Treasury note declining 9.9 basis points, the 10-year Treasury note declining 19.2 basis points and the 30-year Treasury fell 12.9 basis points on the week. Yields did see a rise from the 5-year through 30-year rates on Friday which was accompanied by gains in US equities sparking short term optimism in the market adding to risk on investments. We saw a big sell-off mid-week in equities after the release of CPI data which saw yields rise. Bond yields are highly correlated with mortgage rates and this year mortgage rates moved at the fastest pace in decades. This week was a strong one for bonds and mortgages due to rates starting the week at the highest levels since 2009, making it the best week for mortgages in almost 2 years. The rising rates this week have some suggesting it is from Freddie Mac’s weekly mortgage rate survey boosting news sources. Most survey responses are received on the Monday of any given week, but results are not published until Thursday which leads it to a Monday vs Monday number. The 30-year fixed mortgage rate rose 3 basis points to 5.3%, the highest level since July 2009 versus a year ago being 2.94% with a record low of 2.65% in January of 2021. The 15-year mortgage rate fell 4 basis points to 4.48% versus 2.26%. The 5-year Treasury indexed hybrid adjustable-rate mortgages averaged 3.98%, which was 2.59% this time last year. What is causing the mortgage rates to move higher is directly caused by higher inflation and monetary policy tightening. Monthly payments are up 33% from a year. $300,000 home costs consumers $348 more per month compared to the end of last year. Demand is still high for homes but if that demand cools it will ease some of the supply-demand imbalance and put less stress on upward pricing pressure on housing prices. Per Bloomberg fund flows, the below charts lay out the inflows and outflows into bond ETFs from May 2021 through May 2022 and as you can see most markets strategy ETF’s have seen red this year but minus the flood into Treasuries, Agency, and Munis. You can see the mortgage-backed ETF’s have seen some inflows as of late and could be an option if rates begin to stabilize a bit.
Source: Bloomberg
The United States is still looking at more options to make life harder on Russia forcing them into default by rolling out new sanctions. Russia is due to make a few more payments on Russian Foreign Debt on May 27th but the temporary exemption granted by OFAC expires two days prior which would force them into default. If the extension is granted it would force Russia to continue to tap into valuable reserves to make payment to these western bond holders. The implications would be even more severe if pushed upon Russian companies which are very dependent on foreign creditors.
Hedge Funds
Hedge funds posted negative performance for the week which is not surprising considering the significant decline of global indices. The decline was driven more by beta (market exposure and market sensitivity) than negative alpha. US funds declined the most for the week compared to global, Europe and Asia but all outperformed their relative indices. Short sales outpaced long buying with short sales the largest in 3 months led by single names. Macro products (ETFs/Indices) were net bought for the week. Technology, healthcare and industrials were net bought while financials, consumer discretionary and energy were net sold. While there have been signs of de-grossing, it has been limited to long/short equity funds and limited to long selling. There has also been a rise in turnover. Not only was Monday one of the more challenging days in recent history, but long alpha had one of its worst days in a decade. North American longs were down > 3% more than the S&P. Global funds managed to limit losses to < 2% for the week with the MSCI World down over 4%
Private Equity
Although rising interest rates, inflation and public market volatility will likely have a strong impact on the venture market, the VC trends through Q1 has begun to feel the squeeze of the market as deal sizes valuations are feeling the pressure. Additionally, even though the market provided fewer exit opportunities in Q1, median exit values remained high. Given the lag in private data, analysts suspect the venture market is yet to see the full impact with late-stage VC deals likely to be the first to see impact.
Down rounds, or a fundraising round at a lower valuation than during a previous raise, continue to make up only a very small percentage of all deals completed in Q1 at just 5%. However, if interest rates continue to rise and market volatility continues given the geopolitical climate, analysts suspect that down rounds will likely become more common. Before down rounds become more commonplace, the market will likely see a rebound in investor protective deal terms which have largely been absent from venture rounds over recent years given the increased competition in the market.
A shift to a more investor-friendly market may help to keep valuations high, even though the upside potential for founders would be reduced. With valuations hitting record highs in recent years, the current market puts these values in jeopardy as investors are exposed to a declining exit market.
Data Source: Bloomberg, BBC, Charles Schwab, CNBC, the Daily Shot HFR (returns have a two-day lag), Jim Bianco Research, Market Watch, Morningstar, Pitchbook, Standard & Poor’s, the Wall Street Journal, Morgan Stanley, Goldman Sachs and IR+M
This report discusses general market activity, industry, or sector trends, or other broad-based economic, market or political conditions and should not be construed as research or investment advice. It is for informational purposes only and does not constitute, and is not to be construed as, an offer or solicitation to buy or sell any securities or related financial instruments. Opinions expressed in this report reflect current opinions of Clearbrook as of the date appearing in this material only. This report is based on information obtained from sources believed to be reliable, but no independent verification has been made and Clearbrook does not guarantee its accuracy or completeness. Clearbrook does not make any representations in this material regarding the suitability of any security for a particular investor or the tax-exempt nature or taxability of payments made in respect to any security. Investors are urged to consult with their financial advisors before buying or selling any securities. The information in this report may not be current and Clearbrook has no obligation to provide any updates or changes.