
Economic Data Watch and Market Outlook
Despite the shortened trading week in the US, a significant amount of economic news was reported. The US economy continued to display its resiliency despite the sharp rise in rates over the last 18 months. On Friday, July 7th, the Bureau of Labor Statistics reported that average hourly earnings increased more than expected on both a monthly and year-over-year basis while average weekly hours increased slightly more than expected at 34.4 versus 34.3. Further, the number of people unemployed for an extended period (27 weeks or more) fell from 19.5% to 18.5%.
The labor force participation rate stayed unchanged as 62.8%.
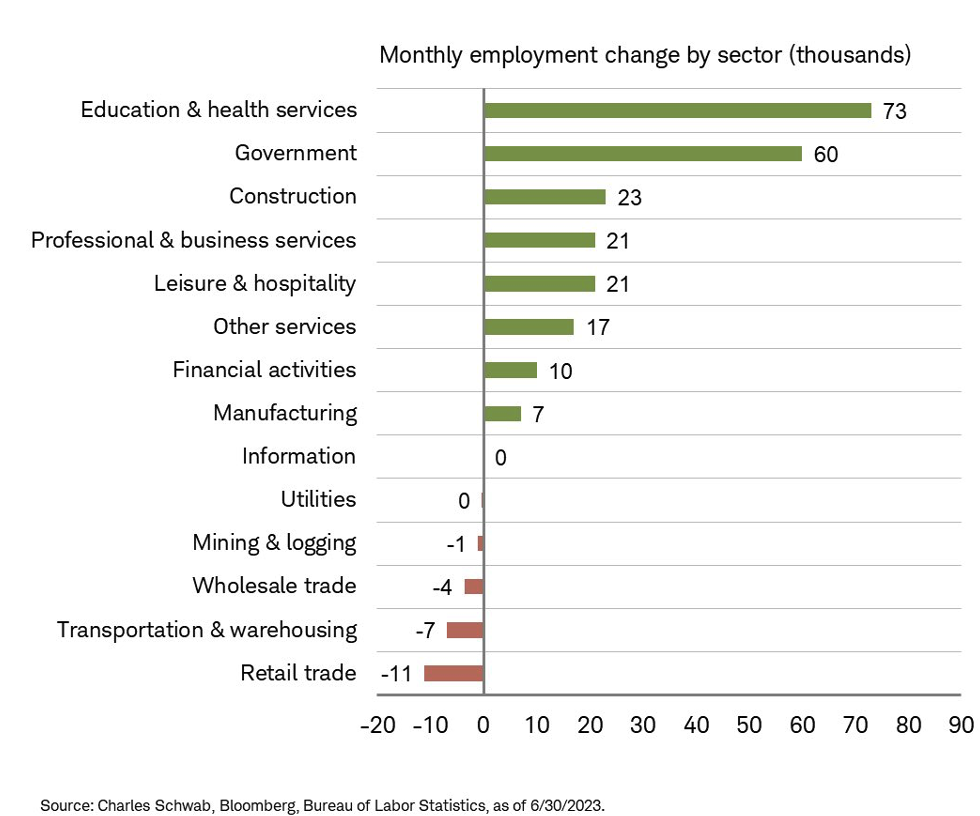
Non-farm payrolls increased by 209,000, slightly less that the 230,000 expectation with the previous month revised down to 306,000 from 339,000. Job growth by sector is visible on the chart below. While only one month of data, note that job losses in the information technology sector are zero.
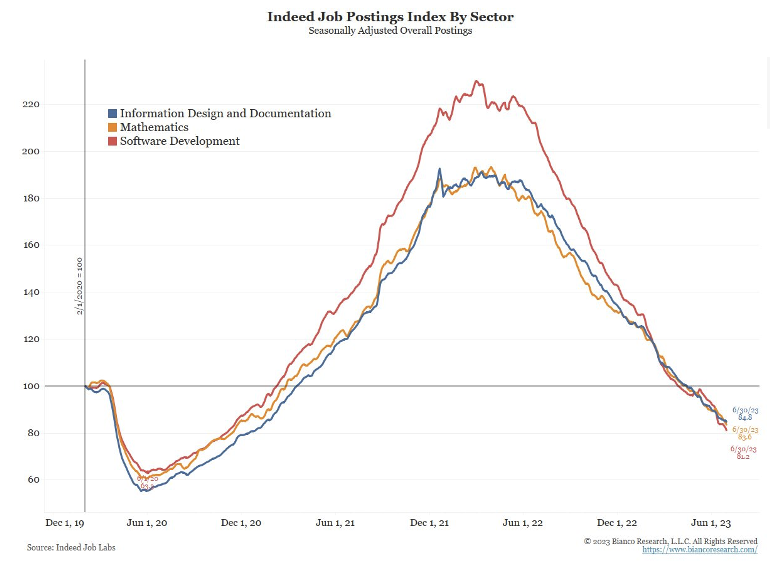
However, as per data from job posting site, Indeed, technology postings have declined significantly:
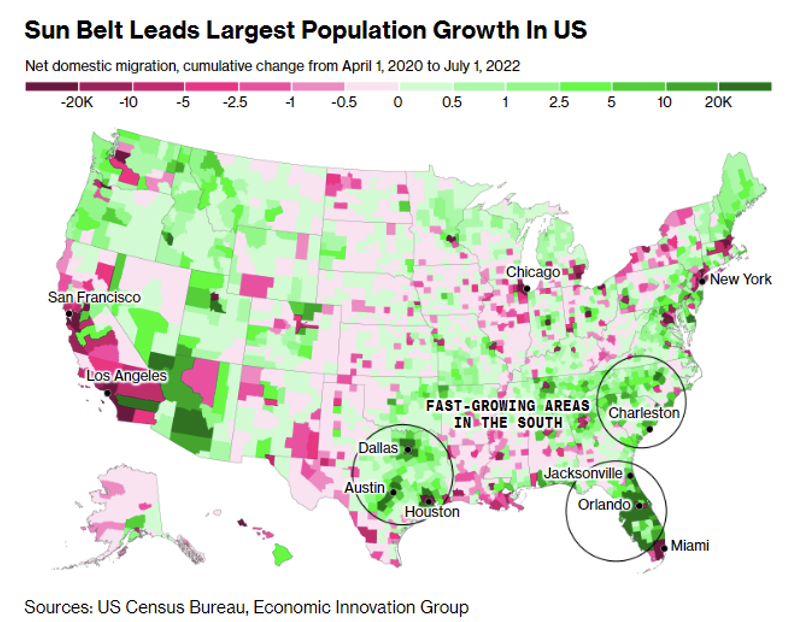
The US economy’s center of gravity is tilting south as the southeast region, including states like Florida, Texas, Georgia, and the Carolinas, contribute more to the national GDP than the northeast for the first time. This shift, which began during the pandemic, is driven by factors such as the relocation of corporations, job creation, and home purchases. The southeast has seen significant job growth, accounting for two-thirds of all job growth in the US since early 2020 and housing 10 of the 15 fastest-growing American large cities. This economic boom has implications for the entire country, but it also brings challenges such as gentrification and inequality in some areas.
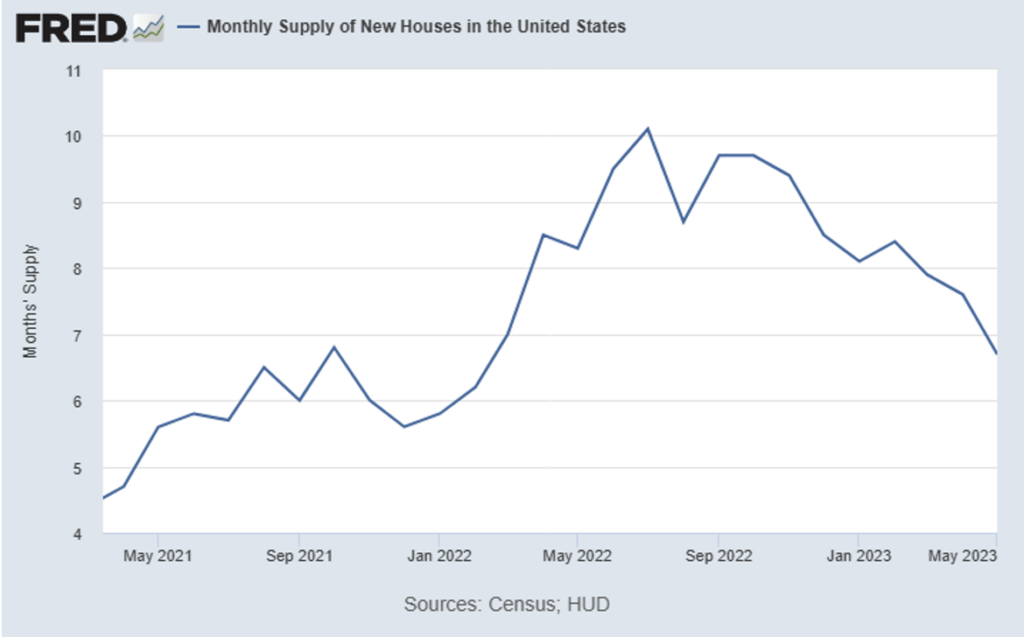
As people are relocating to higher growth areas, it continues to create the need for housing. Construction jobs grew by 23,000 in June, with the average monthly gains over the last year sitting at 15,000. June data shows that jobs for residential construction are up 11% compared to pre-pandemic levels, and that nonresidential construction has lagged, rising just 1.8% on the same basis. The month- over-month data reported on Monday, July 3 was almost double the amount of growth estimated. Home inventories reached their lowest count in over a year in May, highlighting inventory struggles.
CPI, jobless claims, and University of Michigan Consumer Confidence Survey results will be released in the upcoming week.
Equities
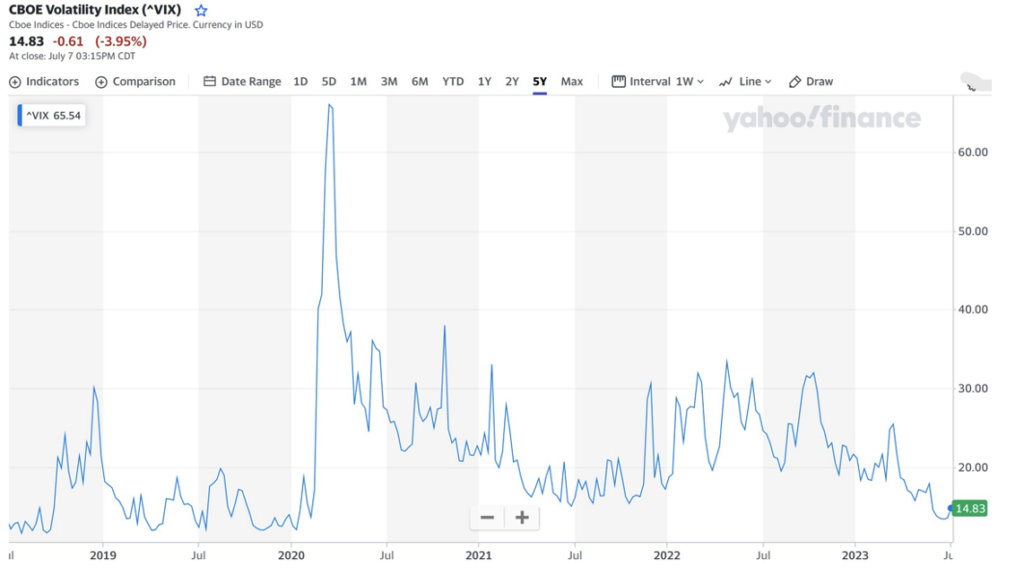
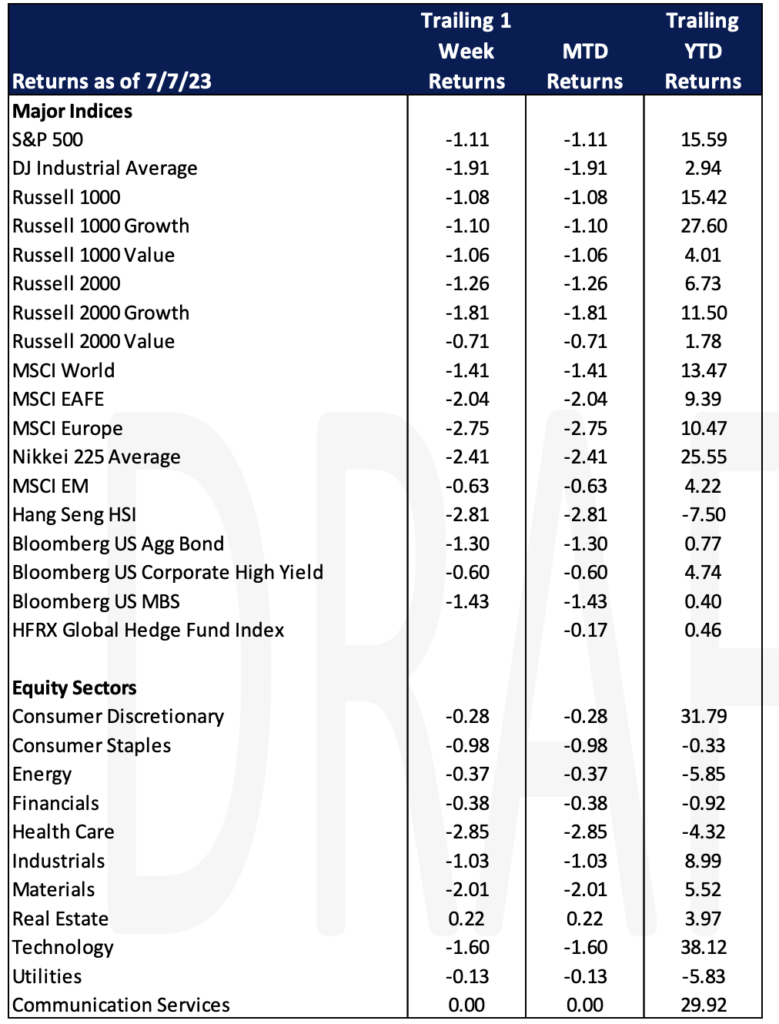
Major US indices moved lower for the second straight week. The Dow Jones Industrial Average fell -1.96%, the S&P 500 dropped -1.16%, The NASDAQ dropped -0.92%, and the Russell 2000 fell -1.27%. Equities were impacted following the strong job numbers and the comments in the FOMC minutes. Weak manufacturing data out of China and new restrictions on exports of AI chips sent stocks lower Wednesday. Only the REIT sector managed a gain on the week as healthcare, materials, technology, and industrial equities were the weakest groups.
Market conditions deteriorated slightly this week as rates moved higher and indices finished lower. Major indices paused this week at their mid-June highs and secondary indices were mixed with the Dow Jones Transportation Index hitting a new 52-week high this week while both the Russell 2000 Index and the Philadelphia Semiconductor Index underperformed the broader market.
Per the American Association of Individual Investors, 46.4% of retail investors are bullish which is the highest number in a year. Professionals are also becoming more bullish coming in at 54.9% which is its highest number since November 2021. US equity funds and ETFs saw inflows of $6.2 billion for the period ending 7/5/23 compared to the week prior seeing $2.8 billion.
Asian equities also finished the week lower with the NIKKEI 225 posting a -2.41% return on the week, The Hang Seng Index saw -2.91%, and the Shanghai Composite Index of Chinese companies also declined -0.17%. Europe was the same as the FTSE 100 Index fell -3.65%, the DAX fell -3.37%, STOXX Europe 600 Index fell -3.09%, CAC 40 Index fell -3.89%, FTE MIB (Italy) Index fell -1.60%, and the IBEX 35 (Spain) Index fell -3.59%.
Fixed Income
Treasury yields rose throughout the shortened week, with the two-year Treasury yield climbing 7 bps to 4.94%, the 10-year Treasury yield climbing 25 bps to 4.06%, and the 30-year Treasury yield rising 20 bps to 4.05%. 10- and 30-year yields reached their highest levels in over a year, while yields on the shorter end of the curve also hit multi-year highs. The catalyst for the moves was a combination of the Fed’s messaging on upcoming rate hikes, and the important labor data published throughout the week. The Bloomberg US Aggregate Bond Index fell -1.30%, the Bloomberg US Corporate High Yield Index fell -0.60%, and the Bloomberg US MBS Index fell -1.43%.

Mortgage rates hit their highest level since the start of 2023 this week, with the average 30-year fixed rate mortgage reaching 6.81% on Thursday according to Freddie Mac. This is the highest reading since November 2022, when weekly mortgage rate readings breached 7%. A resilient economy, persistent inflation, and strong Fed messaging on upcoming rate hikes is driving this new rise in mortgage rates after a relatively stable June.
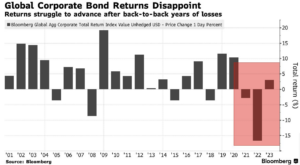
Credit fared poorly this week as well, with two major credit ETFs seeing $2B of outflows in response to the strong jobs report. The iShares iBoxx High Yield Corporate Bond ETF [HYG] saw outflows of $1.13B, and iShares iBoxx $ Investment Grade Corporate Bond ETF [LQD] saw outflows of $664.3 million, the largest set of outflows the ETF has seen since March. Corporate credit has not fared as well as investors expected so far this year, with the common expectation being double digit returns. The failure to trend towards these returns has fueled several more bearish bets on the credit market. So far global corporate debt has returned just 3%. Bank of America, which initially was targeting gains of over 10% for high grade corporate bonds has revised its year-end target down to 8%.

Hedge Funds – As of Thursday, July 6th
Global equity markets declined in the shortened trading week with hedge fund (HF) performance generally in-line compared to historical down markets. The average global HF posted losses of 46 bps vs. the MSCI World down 1.3%, capturing ~36% of the indices’ downside. Long short equity (L/S) performance was more challenged this past week (global L/S down 84 bps WTD through Thursday), with those based in the Americas experiencing more of the pain; Americas-based L/S was down ~1% through Thursday vs. S&P 500 -85 bps. Outside of the US, Europe-based funds held in much better as they were down just 37 bps vs. the index declining >3.1% and Asia HFs (inclusive of all strategies in the region) and Asia L/S funds were down 20 bps and 37 bps respectively on the week vs. the MSCI Asia Pacific down 37 bps. The crowded longs and shorts generally performed in-line with their benchmark indices in North America (NA) and Europe (EU). Crowded performance was more challenged in Asia as shorts outperformed longs by >1.3%.
In-line with the lighter volumes, gross and net activity across global equities was relatively quiet. In NA, the flow was more paired off as buying of index-level products offset HFs selling most single-name sectors. At the single-name level, HFs continued to pullback their directional exposure to healthcare (a consistent trend since start of June), with last week’s net selling a mix of short adds and long sells (across most industries within the space led by pharma). HFs also sold longs and added shorts across communications services, industrials, and real estate while consumer-related sectors were the lone pockets of the market to end net bought on the week (mix of long adds + short covers). The US industrials long/short ratio hovers just above multi-year lows as the sector saw the largest net selling since December 2022. This week’s notional net selling ranks in the 86th percentile vs. the past five years. In other regions, European equities were slightly net bought as long adds outpaced short additions (HFs added gross exposure to EU equities). At the sector level, the long flow was mostly seen across more cyclical-related sectors (EU consumer discretionary, industrials, and energy), whereas the majority of the short adds were concentrated in EU financials and healthcare. HFs were small net sellers of Asia ex-Japan equities as they trimmed longs in Australian equities and added short exposure to China (particularly A-shares). Meanwhile, Japan ended as the most net bought region (in relative terms) as HFs added longs in industrials, financials, and consumer discretionary.
Private Equity
According to the Q2 2023 PitchBook-NVCA Venture Monitor, the venture capital market is showing signs of stabilization after a significant correction that began last year. However, investor optimism is yet to fully recover, despite the enthusiasm surrounding generative AI and the resurgence of large tech stocks. Investors are being cautious in their deal selection, considering the challenging future fundraising environment and the potential for further drops in startup valuations.
In Q2, US VC-backed companies raised $39.8 billion, marking a 48% decline year-over-year. However, when viewed in a broader context, US startups are expected to raise a similar amount to what they did in the record year of 2020. Startup prices are decreasing as investors exercise their increased negotiating power, but they remain relatively high compared to pre-2021 levels at most stages, except for the seed stage where valuations are slightly higher than last year. The sharpest decline in valuations has been observed at the venture-growth stage, with the median pre-money valuation falling 62% YoY to approximately $126 million. Early-stage valuations, which were previously growing, are now in retreat, with the median valuation dropping by 20% this year to $39.8 million.
Notable exits in the VC-backed space have been limited so far in 2023, as the IPO market has not attracted significant tech listings, and corporate cost-cutting and higher borrowing costs have dampened acquisitions. This lack of exits results in fewer returns to limited partners and less cash available for commitments to new funds. US VC fundraising in the first half of the year reached only $33.3 billion, putting it on track for the lowest annual total since 2017.
Despite these challenges, there are some positive signs, such as the ongoing recovery of tech valuations in public markets and a recent increase in listings, which could potentially attract startups back to the IPO market.
Authors:
Jon Chesshire, Managing Director, Head of Research
Elisa Mailman, Managing Director, Head of Alternatives
Katie Fox, Managing Director
Michael McNamara, Analyst
Sam Morris, Analyst
Joshua Friedberg, Summer Associate
Data Source: Apollo, Barron’s, Bloomberg, BBC, Charles Schwab, CNBC, the Daily Shot HFR (returns have a two-day lag), Goldman Sachs, Jim Bianco Research, Market Watch, Morningstar, Morgan Stanley. Pitchbook, Standard & Poor’s and the Wall Street Journal.