
Economic Data Watch and Market Outlook
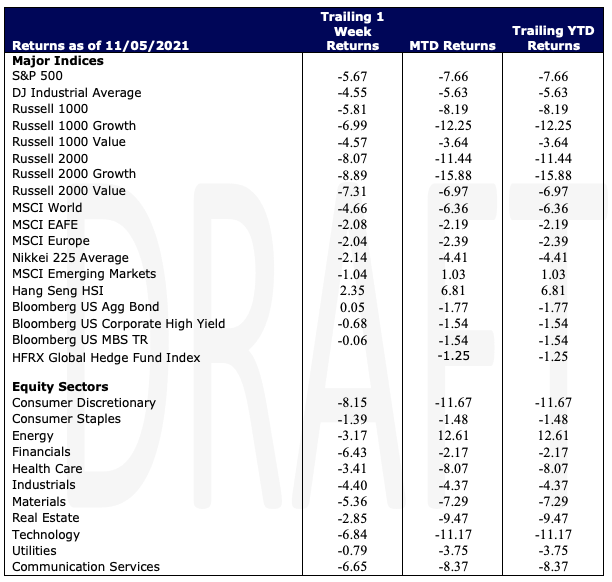
Investors are coming to grips with the likelihood of rate increases in the very near future and thus far January has not proved to be a great start for the markets in 2022 (the worst start since 2016). The S&P 500 has declined 7.66% YTD after dropping 5.67% for the week. Inflation data, rising interest rate concerns, saber rattling on the Ukraine border and continued pressure of COVID on human life and the supply chain roiled equity markets in the US and abroad.
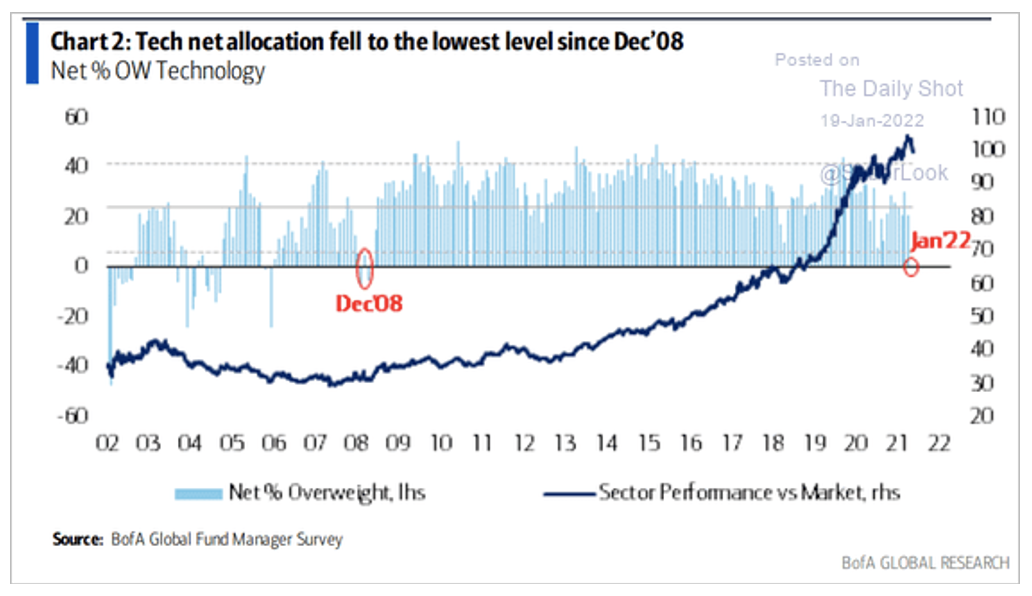
Rising yields and the fear that they will continue drove investors from Tech. Tech and Consumer Discretionary fell 6.84% and 8.15% for the week respectively and brought their YTD decline to -11.17% and -11.67% respectively. Window dressing at year end or selling in advance of rate rises has caused tech to be at its lowest level since 2008 according to a recent BofA Survey.
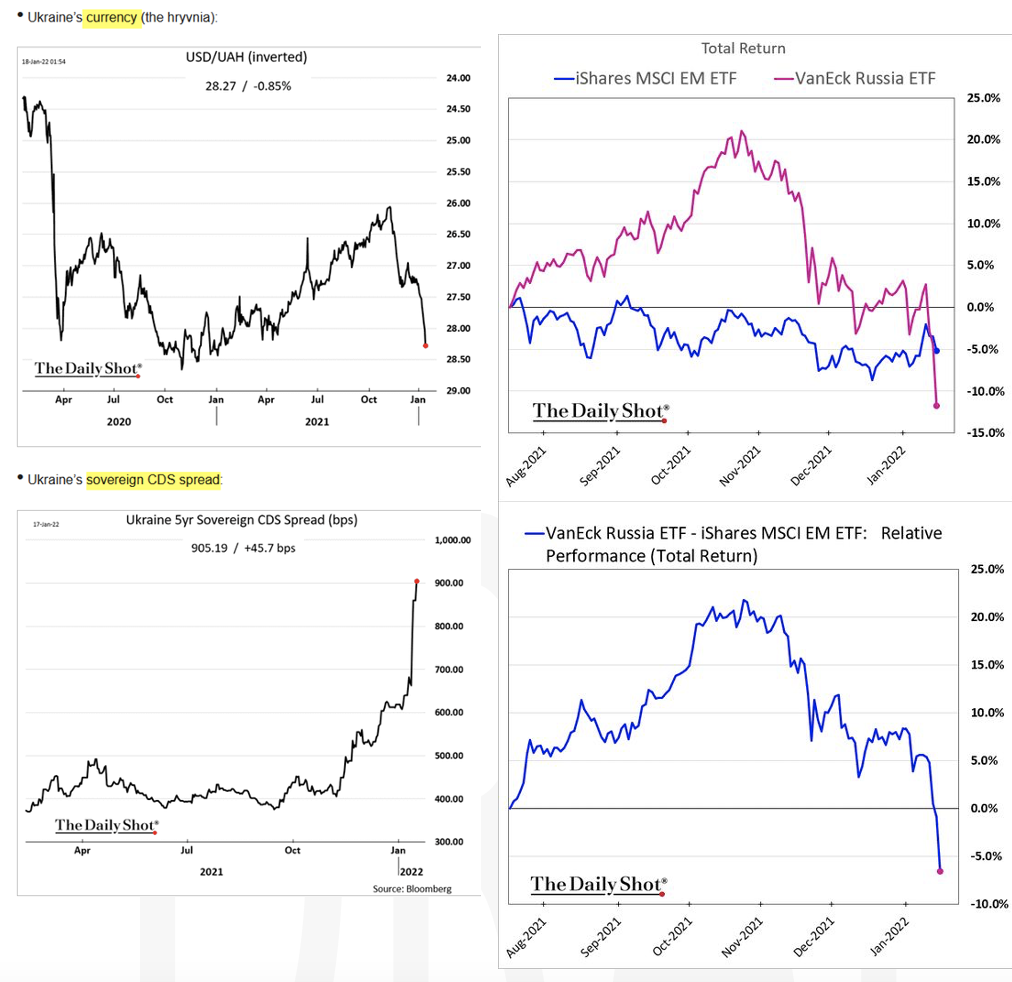
Over the weekend, families of US diplomatic staff were told to evacuate Ukraine. The markets seem to indicate that trouble was on the horizon as Russia continues to amass troops on the Ukraine border. Perhaps geopolitical theater but markets started to price in risk early during last week’s trading. See chart below of the Ukraine hryvnia versus the USD, and the spread on CDS. Another indication was the decline in Russian ETF’s, also visible below.
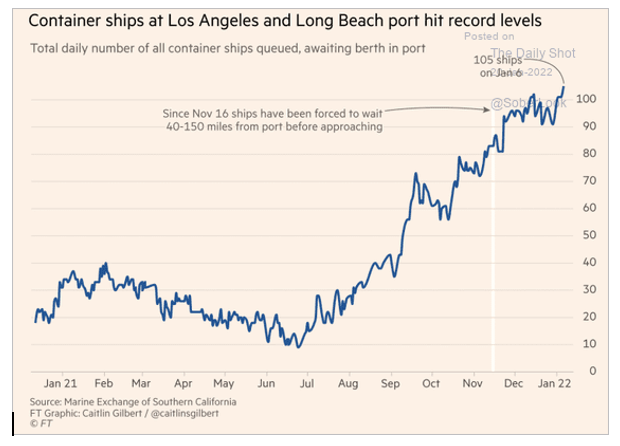
Winter weather and Covid have continued to put pressure on the US supply chain. In addition to labor shortages, due to Covid, winter weather created havoc in the Carolina’s and along the Washington beltway. In the west, LA ports looked to be seeing some progress but in the last few weeks, ships have started to get backed up again. Further, a much-publicized story showed unfathomable amounts of theft along Los Angeles railway causing further delays to the supply chain. While much of this is leading to a push for more manufacturing in the US, that is not an immediate solution as manufacturing plants can take years to permit and build.

US equities, represented by the Russell 1000, fell roughly 5.81% causing the benchmark to fall 8.2% year-to-date making it the worst start since 2016. Much of the decline has been attributable to what Yardeni Research considers the Mega -Cap 8, Alphabet (both classes), Amazon, Apple, Meta (formerly Facebook), Microsoft, Netflix, NVIDIA and Tesla. According to S&P Global, these eight stocks have been responsible for over 40% of the YTD decline. Much has been discussed about the high valuations of the market. The P/E of the S&P500 as of Friday was 27.24x. If you remove the Mega-Cap 8, the PE would be 17.6x.
Large growth stocks, as represented by the Russell 1000 Growth, fell 6.99% which brought their year to date return to -12.25%. The Russell 1000 Value had been positive until last week’s trading. The benchmark fell 4.57% and on a year-to-date basis is now down 3.64%.
Every economic sector was negatively impacted during last week’s trading. As noted above, technology stocks and consumer discretionary stocks were hit the hardest but financials and communication services were also significantly impacted, each falling more than 6%. Utilities were the top performer, falling only 79 basis points.
The Russell 2000, a measure of small cap performance, fell 8.07%. The Russell 2000 Growth fell 8.89% percent while the Russell 2000 Value fell -7.31%.
Despite the geopolitical turmoil, international equities, measured by the MSCI EAFE benchmark, fell only 2.08% with European stocks falling 2.04%. Emerging markets was the strongest performer, falling only 1.04%. Stocks trading in Hong Kong actually increased 2.35%, Chinese property developer Evergrande secured approval from investors to delay payments and another developer in China, Country Garden Holdings raised $501 million in a convertible bond offering.
Fixed Income
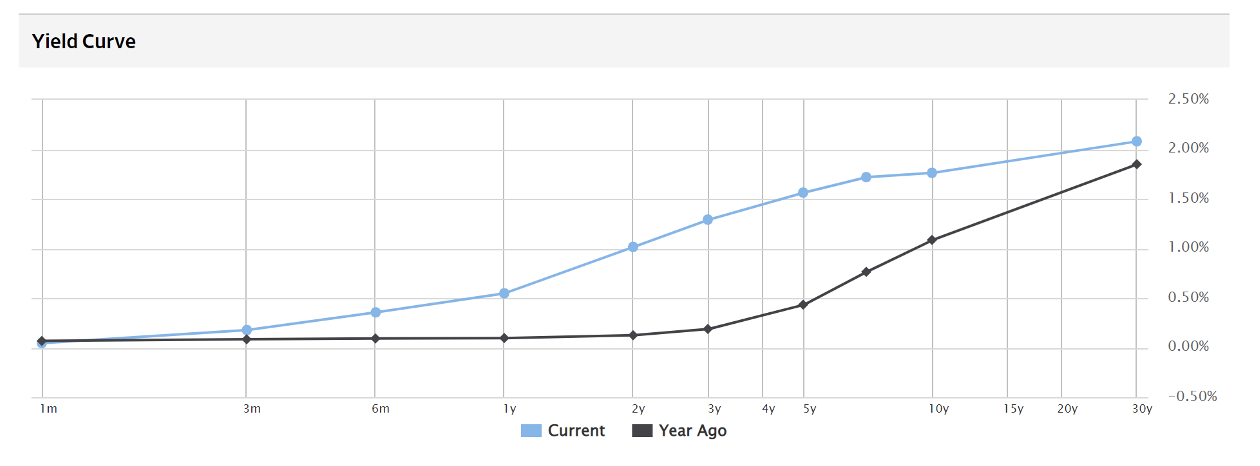
The Aggregate Bond Index advanced five basis points for the week. The 30-year yielding 2.089%, the 10-year 1.77% and the two-year 1.033%. The belly of the curve has somewhat flattened versus a year ago. See below from the WSJ.
Interest rate stories aside, fixed income markets are adjusting to a benchmark change that is the basis for loans in the US. The well-known London Interbank Offered Rate (LIBOR) is no longer offered by US lenders starting January 1st and has been replaced by Secured Overnight Financing Rate (SOFR) which is roughly a volume measure of tri-party repo transactions. However, it does mark changes to a variety of asset backed securities and loan agreements causing contracts to be adjusted for new issues which could cause a brief delay in new issuance. LIBOR is not entirely going away but will be phased out until 2023.
Hedge Funds and Private Equity
With major global indices retreating this past week, hedge funds were able to hang in relative well. According to Morgan Stanley, the average global long/short fund posted losses of 90 basis points compared to a -250 basis points for the MSCI World Index. Similarly, US based funds only felt a fraction of the loss with the average fund down 140 basis points compared to an almost 390 basis point loss for the S&P. One reason why the performance hung in was the top 50 crowded shorts worked relatively well, as they were down -5.7% in North America this week, bringing YTD performance to -12.4%. With that being said, long alpha across the top 50 crowded longs in North America has continued to weigh on returns – the crowded longs slightly underperformed the S&P this week (-4.6%). As for other regions, the average Asia-based fund was down ~90bps for the week and is now down -2.1% for the year despite the MSCI Asia Pacific Index being up +30bps through Thursday. Europe-based funds have been the top performers thus far in 2022, with the average fund’s returns this week essentially flat, leaving the average EU-based fund and average EU-based L/S fund down less than ~20bps for the year. The trend in flows this week was that HFs were net sellers of global equities, with North America being the most net sold of any region. The net selling in North America was due entirely to short additions, which all strategies contributed to – long flows were more mixed by strategy, though it is worth noting, that long/short funds sold longs on a net basis. The short additions in North America were spread across a number of sectors, with cyclical sectors (discretionary, industrials, energy), healthcare, financials, and index-level products seeing the largest amount of short adds. Outside of healthcare, flows to more traditional defensive sectors skewed more towards net buying, with utilities and real estate among the most net bought. Tech was also slightly net bought, as positive net flows to IT services and software offset the selling seen in semiconductors this week. That said, according to Goldman Sachs, hedge funds are the most underweight US information technology on their record, though absolute net allocation to the sector is still above its 5-year average. Outside of North America, hedge funds sold longs in Europe and in Asia ex-Japan, which ultimately led both regions to be net sold. In Europe, the selling was led by EU utilities, financials, and to a lesser extent, EU cyclicals. In Asia ex-Japan, the net selling was seen in most countries with the exception of China, which was slightly net bought (long adds in A-shares and ADRs) – by sector, the selling of Asia ex-Japan was led by technology staples.
Private Equity
US Mega-Fund Fundraising & Performance
As private equity continues to shift to both larger funds and deal sizes, the US has seen a substantial increase in PE mega-funds, or vehicles worth at least $5 billion. Mega-funds accounted for nearly half of all capital raised in recent years, totaling $143.4 billion in 2021 alone.
Mega-funds are taking advantage of the flurry of fundraising and record-setting deal activity driven by high valuation multiples and quick realizations during the post pandemic economic recovery. Expedited fundraising and distribution cycles are allowing LP’s to receive capital back sooner which is often then recycled into new fund commitments. Additionally, robust performance and increased capital returns are leading LPs to boost allocations to the same large PE firms, reinforcing the robust growth cycle.
At the forefront of this robust growth cycle, are public PE firms in particular. These public mega-funds continue to shatter previous growth records amassing astounding levels of AUM in recent years. Blackstone, as well as five other public mega-funds, will each seek to raise funds in the range of $25-$30 billion in 2022. Analysts predict this impressive mega-fund performance will likely persevere given the rapid pace of realizations and healthy market backdrop.
Crypto Currencies
The market significantly sold off toward the end of last week with Bitcoin dropping below $35,000 over the weekend, off almost 50% since it’s high in November. The fallout has affected just about all crypto assets and has caused stress to some protocols such as Solana which is meant to compete with Ethereum. Solana’s network shut down over the weekend for several hours as the industry continues to develop. Issues such as these will only help to strengthen protocols over the longer term. There was cause for concern early in 2021 when China banned mining and impaired the processing power of the network, also called Hashrate. Processing power declined for a few months but gradually increased and the Hashrate has recovered since and is stronger.
Data Source: Bloomberg, CDC, CNBC, the Daily Shot HFR (returns have a two-day lag),Financial Times, Morningstar, Pitchbook, Standard & Poor’s, US Census Bureau, the Wall Street Journal, and Yardeni Research
This report discusses general market activity, industry, or sector trends, or other broad-based economic, market or political conditions and should not be construed as research or investment advice. It is for informational purposes only and does not constitute, and is not to be construed as, an offer or solicitation to buy or sell any securities or related financial instruments. Opinions expressed in this report reflect current opinions of Clearbrook as of the date appearing in this material only. This report is based on information obtained from sources believed to be reliable, but no independent verification has been made and Clearbrook does not guarantee its accuracy or completeness. Clearbrook does not make any representations in this material regarding the suitability of any security for a particular investor or the tax-exempt nature or taxability of payments made in respect to any security. Investors are urged to consult with their financial advisors before buying or selling any securities. The information in this report may not be current and Clearbrook has no obligation to provide any updates or changes.