
Economic Data Watch and Market Outlook
We have started the year off with the Omicron cloud. Although it thankfully seems less deadly than its predecessors, the impact to schools, hospitals and the timeline to return to normal have all been affected. Risk assets focus carefully at discounting the future which is difficult in a pandemic. However, this week the Federal Reserve made that more difficult. The minutes released this week were much more hawkish than investors hoped for which proved challenging to equity prices. These two factors contributed to the S&P 500 getting off to its worst yearly start since 2016. NASDAQ stocks were off roughly 4%. Further, although it is very early, the question that arises is what the impact will be on the yield curve. Will be with a strong bias towards tightening? The probability of an inverted yield curve seems to be rising.
When the year begins, economists prognosticate about annual GDP growth, but traders must dig deeper to see the quarter- by- quarter changes. Assuming the FOMC does indeed tighten more than once, growth will probably be more front loaded in the first half of the year. At some point the question will be whether the FOMC moves too aggressively to thwart longer term growth or just enough.
Wage and commodity inflation also appear to be robust and employers are still hiring. Deconstructing the Unemployment rate of 3.9% we find positive signs in just about every segment.
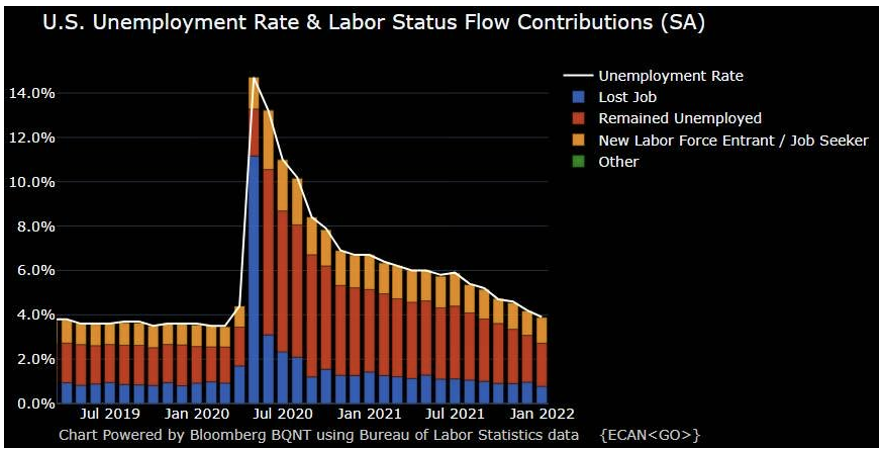
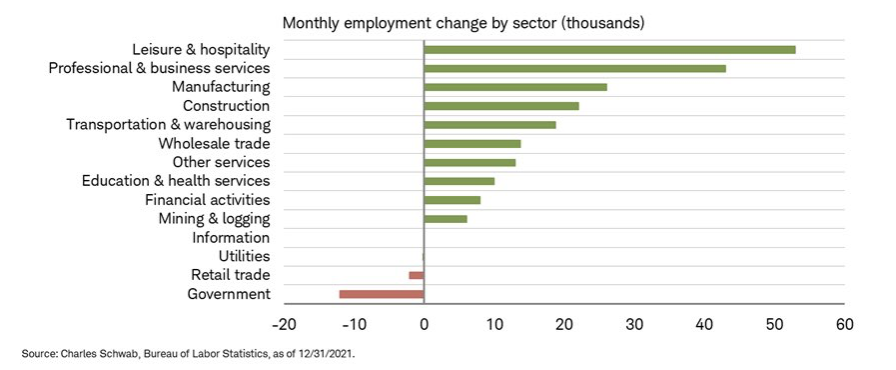
As we have noted in past commentaries, the JOLTS results (people quitting their jobs) has largely been because they are leaving for greener pastures, not quitting the workforce entirely. Many headlines noted the amount of Leisure workers quitting their jobs in November. However, the expansion in that sector, among others, tells a different story as it turned out to be the highest growth area (same as in November).
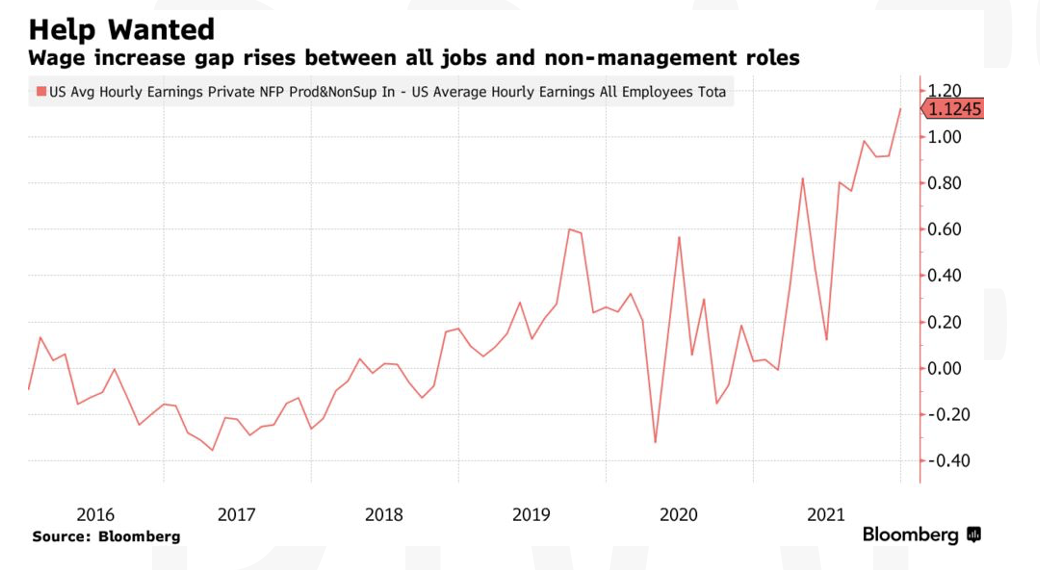
As the recent chart below from Bloomberg demonstrates, wages continue to rise. It’s also noted that Walmart, just one year ago, was paying $14 per hour and has since raised wages to an average of $16.40. While the price of a gallon of gas (currently $3.30 a gallon according to AAA) may come down, wages tend to be stickier.
This week we’ll learn more about how inflation is shaping the economic picture in multiple countries as Brazil, China, France, India, Spain, and the United States, among others, report their variation of the CPI, PPI, and money supply growth. Later in the week, we’ll also learn about manufacturing production and retail sales in the US.
Longer term, we still believe in risk assets but as reports come out about a new “Deltacron” variant will likely continue to see further volatility.
Equities
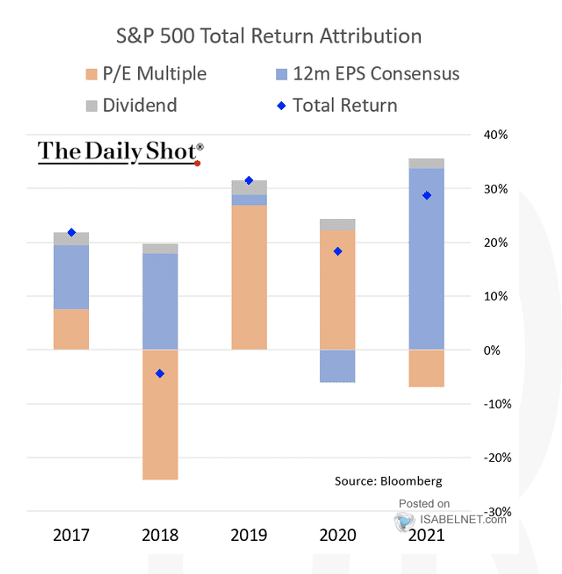
As noted above, the S&P500 got off to a rough start with the benchmark falling 1.91%. Growth stocks, as measured by the Russell 1000 Growth Index, fell 2.99%. The Russell 1000 Value fell only 56 basis points. Small cap stocks declined 1.68% with both growth and value having similar results. The upcoming week will mark the start of earning season and will test investors’ appetite for stocks in a rising rate environment. As we deconstruct the S&P’s return in 2021, we see that most of the return was due to earnings improvement. While we will likely see slower growth in 2022, earnings and dividends may play somewhat of an equal part in the S&P’s return.
Within the S&P 500, Consumer Discretionary, Energy, and Technology stocks all fell more than 4%. Stocks in more yield-oriented sectors such as Consumer Staples, Real Estate, and Utilities all rose but their weight within the index were clearly not enough to drive it into positive territory.
In international markets, many eyes are focused on Russia’s military and how positioning near Ukraine and Kazakhstan could affect the flow of gas into Europe and China. Both have affected the rise in gas prices. Kazakhstan is a major supplier of Gas to China and also holds significant amounts of Uranium.
Eyes are also on China and it’s handling of COVID as the Winter Olympics approach. China’s tech shares continue to fall and property development companies, most notable Evergrande, continue to stress EM Bond markets.
The MSCI EAFE index fell 46 basis points in USD terms. European stocks fell 60 basis points while Japanese stocks rose 38 basis point. Japan is the largest weight in the EAFE at 22.51%.
The MSCI EM benchmark fell 1.76% dragged down by Chinese stocks which fell over 3.35%.
Fixed Income
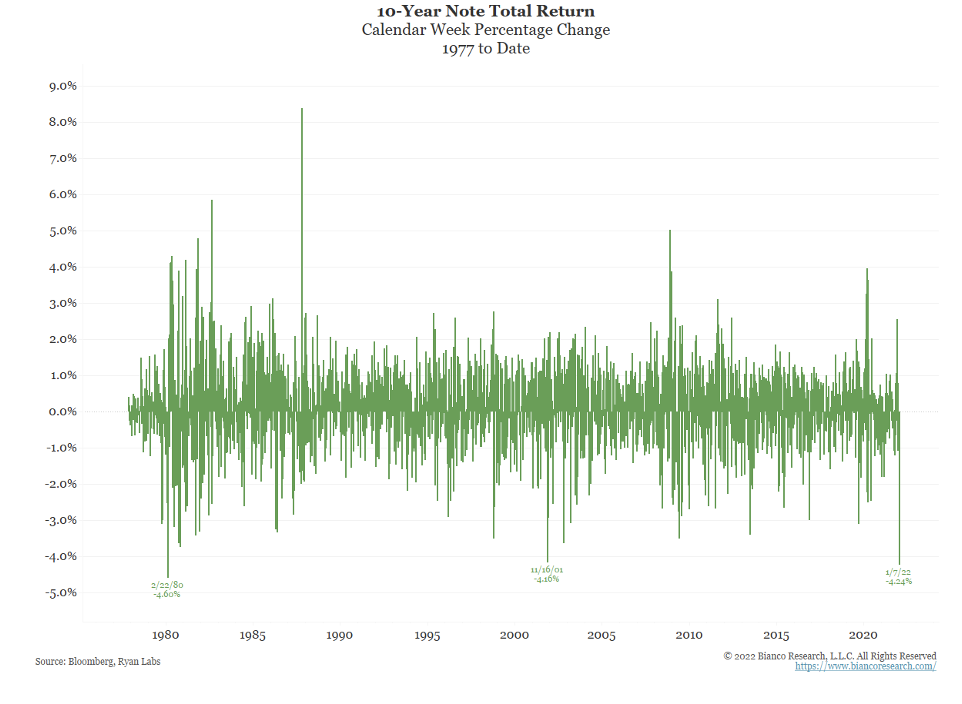
The question of when the Fed will raise rates continues to fuel fears and create volatility in equity and fixed income markets. Ten-year rates rose slightly more than 27 basis points during the week from 1.496% to 1.769%. For context, we’re roughly at the levels seen at the at the end of 2020. While the level may not necessarily be concerning, the rate of change is clearly an indicator of the level of volatility we may see going forward until there is more clarity around COVID, Supply Chain disruptions, and how both effect inflation and employment, the dual mandates of the US Federal Reserve. The change in the 10 year was so severe, it was the worst total return (Price change + yield/accrued interest) year (-4.24%) since 1980 and led investors to fear that the free money from the Fed is coming to an end.
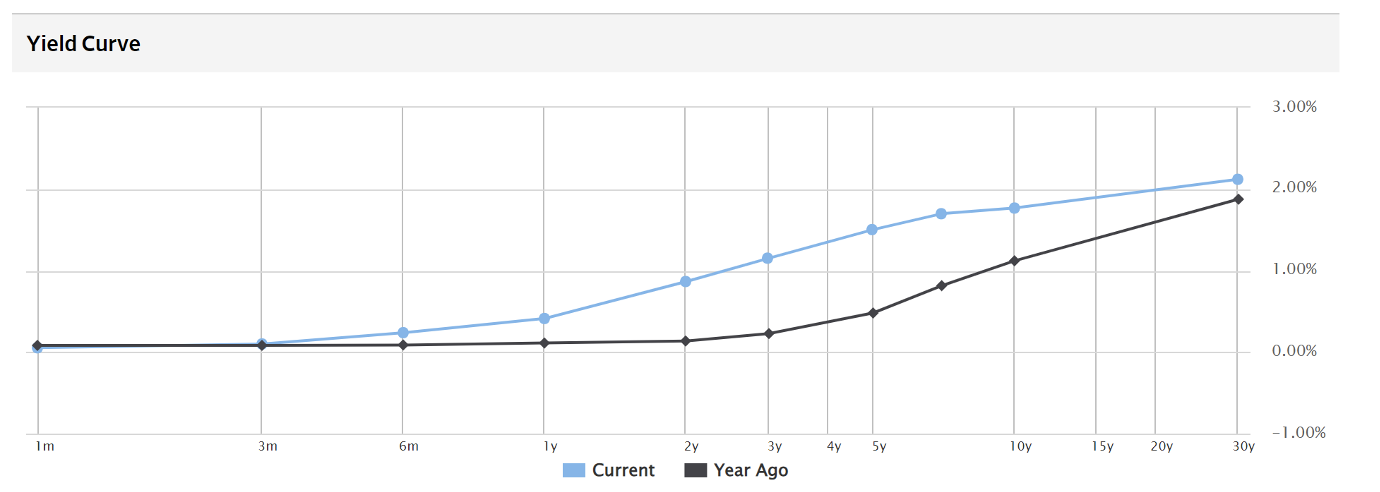
Concerns around the curve flattening, or even inverting, remain discussion points by the pundits on CNBC and Bloomberg. The table below from the WSJ, shows the curve as of Friday versus one year ago.
Hedge Funds and Private Equity
The first week of 2022 saw much of the same following 2021 with North American long/short funds down more than the S&P. Growth longs continued to plague these funds as crowded longs significantly underperformed and these tend to lean heavier towards growth. The spread between growth and value net exposure is now at a 5+ year low for these funds. Global funds, however, even though down, were down less than the MSCI World. Crowded names in Asia performed similar to the US, but those in Europe outperformed their relevant indices. Gross and net leverage has fallen to 12-month lows from a combination of negative performance and selling. Japan and Europe were the only regions to see net buying for the week. In Europe the buying was not from long/short funds, but quant, multi-strategy/macro and event driven.
In less liquid investments, Fintech packs a decade worth of exits into just nine months. In the first three quarters of 2021 alone, venture-backed fintech exits surpassed $244 billion, more than the combined total for the entire prior decade. The industry has seen a steady transformation towards digitization over the past year, benefiting the growing ecosystem of fintech startups. Leading the supersized exits in 2021 was the trading platform Robinhood and the restaurant point-of-sale software Toast.
Along with these supersized exits, investors’ price sensitivity has plummeted with the median fintech valuation multiple at 21.7x revenue and the typical late-stage, pre-money deal value at $265 million. Early-stage median pre-money valuations continue to reach new highs as well at $40 million, up from $35 million in Q2.
Analysts predict that autonomous finance, the full automation of financial management, will present new opportunities and enterprise uses cases and continue to drive fintech growth in the coming year. Combined with artificial intelligence and machine learnings, analysts predict fintech will automate key functions within the CFO suite including controller, treasury and FP&A.
Data Source: Bloomberg, Bureau of Labor Statistics, CDC, CNBC, HFR (returns have a two-day lag), Morningstar, Pension and Investments, Pitchbook, Standard & Poor’s, US Census Bureau, and the Wall Street Journal
|
This report discusses general market activity, industry, or sector trends, or other broad-based economic, market or political conditions and should not be construed as research or investment advice. It is for informational purposes only and does not constitute, and is not to be construed as, an offer or solicitation to buy or sell any securities or related financial instruments. Opinions expressed in this report reflect current opinions of Clearbrook as of the date appearing in this material only. This report is based on information obtained from sources believed to be reliable, but no independent verification has been made and Clearbrook does not guarantee its accuracy or completeness. Clearbrook does not make any representations in this material regarding the suitability of any security for a particular investor or the tax-exempt nature or taxability of payments made in respect to any security. Investors are urged to consult with their financial advisors before buying or selling any securities. The information in this report may not be current and Clearbrook has no obligation to provide any updates or changes. |