Economic Data Watch and Market Outlook
Global equity prices as represented by the MSCI World Index fell 2.60% for the week. The Bloomberg Aggregate Bond index fell just 12 basis points. Inflation seemed more persistent despite continued measures by central banks globally. In addition, Biden’s surprise visit to Ukraine sparked escalated comments from Russia, and China has become more involved in the Ukraine-Russia, war suggesting peace via political solution.
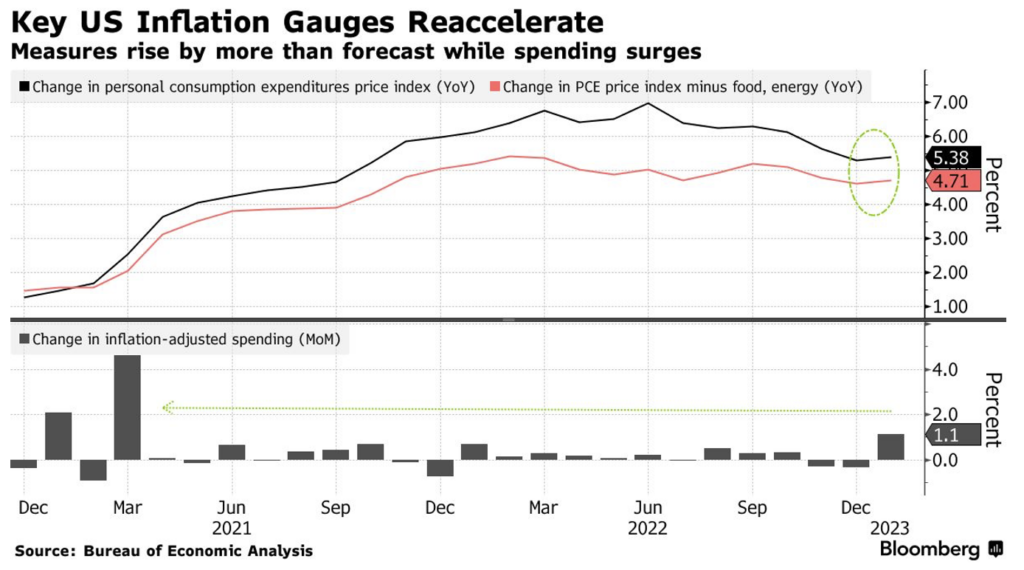
One of the Federal Reserve’s primary inflation measures accelerated unexpectedly in January. The personal consumption expenditures price index rose 5.4% year over year and rose 0.6% from a month earlier, the largest increase since June 2022. The unexpected jump of PCE is expected to increase pressure on the Fed to continue raising rates throughout the coming year. As of Friday, the fed-funds futures market is pricing a target rate of 5.40%.
This week we’ll learn more about the state of US Manufacturing as ISM data is released for February on Wednesday. US Jobless claims will also be released. Globally, we’ll be watching the European Union and Japan’s CPI results.
Equities
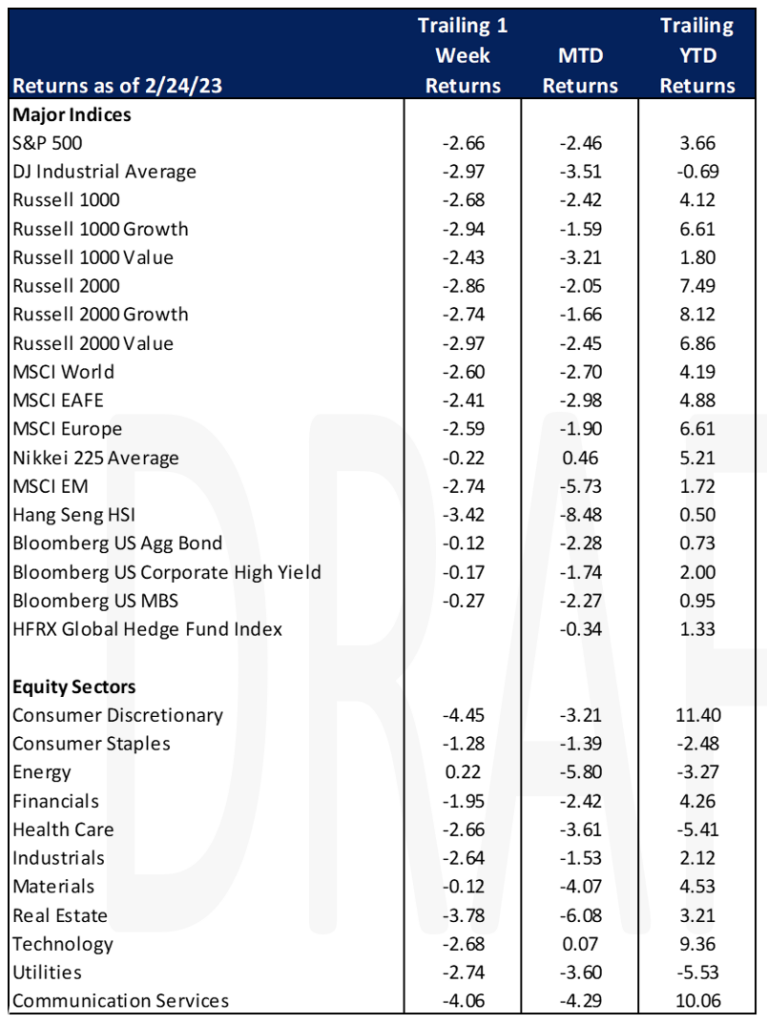
As noted above, the S&P 500 fell 260 basis points on the week and the Russell 1000 fell 268 basis points. Growth stocks fell more than value in both large cap names (R1000G, -2.94% vs. R1000 V. – 2.43%). Small cap names dropped 2.86% with value names falling more than growth, Russell 2000 Growth, -2.74% vs Russell 2000 Value, – 2.97%.
Consumer Discretionary stocks were hit the hardest, falling 4.45% as retail sales results were the worst since July 2022. Brick and mortar retail stocks such as Dillards and Nordstrom fell 13% and 12% respectively. Auto retailer Carvana fell 30% after their loss widened. Autonation fell 11% as the used auto market began to slow. Energy stocks finished slightly positive, advancing just 22 basis points.
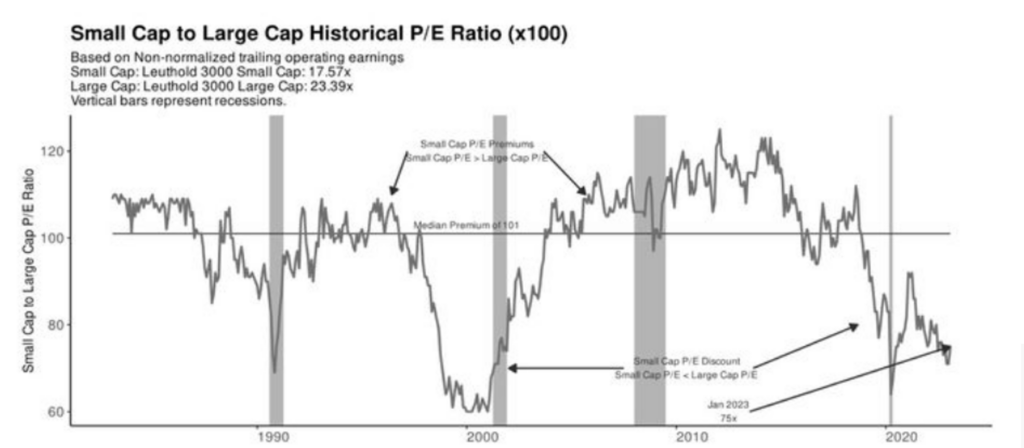
Based on trailing operating earnings, small cap stocks are trading at a 25% discount to large caps, one of the largest discounts since the 1980s. 2023 forecasts show small cap stocks trading at 16 times earnings compared 19 times earnings for large caps, and 21 times earnings for the top 50.
Emerging markets fell 2.74% as Chinese names pulled the benchmark down. The Hang Seng index fell 3.42%.
Fixed Income
In response to the unexpected Personal Consumption Expenditure result, the 2-year Treasury yield rose 18 bps throughout the week, while the 10-year Treasury yield rose 13 bps, and the 30-year Treasury yield rose 5 bps. For the month of February, the 2-year Treasury yield has risen 57 bps, the 10-year Treasury yield has risen 43 bps, and the 30-year Treasury yield has risen 28 bps. The Bloomberg US Aggregate Bond Index fell -0.12% throughout the week and is down -2.27% for the month. Muni fund inflows reached $1B a week throughout January according to Refinitiv Lipper Alpha, with inflows slowing in February. Investors pulled $1.6B from muni markets for the week ending this past Wednesday. The Bloomberg Municipal Bond Index is down -2.29% since the start of February.
Hedge Funds (as of Thursday, February 23rd)
Equity indices globally tracked lower for the seven days ending February 23rd, while hedge funds in most regions were able to limit their losses. The average global fund declined just 36 bps vs. -150 bps for the MSCI World, Americas-based equity long/short funds were down 70 bps compared to 160 bps for the S&P 500 and Asia-based funds declined 62 bps compared to 130 bps for the MSCI Asia. European funds fared the worst for the week in relative terms losing 30 bps vs. 33 bps for the Euro STOXX 600. Crowded shorts worked well in all regions with shorts in North America underperforming the S&P by 2% resulting in a 2.7% long/short spread for the week. In Europe the spread was slightly positive and in Asia it was flat. Trading volumes were lighter for the shortened trading week. From a net perspective, flows were relatively flat, but hedge funds did add to gross exposure across most regions. In North America, longs were added across single name sectors while shorts were added in index-level products. Tech was the most net bought sector particularly concentrated in semiconductors. Funds also were buyers of financials, staples and more cyclical sectors (energy/materials). The focus of the buying was larger, higher quality profitable companies vs. SMID less profitable ones. Outside of NA, HF were small net buyers of EU equities driven by multi-strategy and global macro funds. The buying was concentrated in EU financials, industrials and consumer discretionary while selling took place in EU energy and utilities. In Asia, HF were small net sellers in both Asia ex-Japan and Japan (mostly in China).
Private Equity
Although 2020 and 2021 brought an all-time high for SPAC listings, or special purpose acquisition companies formed strictly to raise capital through an IPO to acquire or merge with an existing company, investors have seen these listings slump over the past year. Analysts credit this largely to the downturn in public markets and the pure volume of SPACs launched over the past two years.
According to PitchBook a total of 791 SPACs were listed in 2021, however since the start of 2022 there have only been 467 acquisitions. Given there are still hundreds of SPACs in the market for a merger, rising interest rates, inflation and geopolitical concerns, competition for quality targets is fierce. Additionally, SPACS that have managed a business combination have been hit especially hard by the market downturn. According to Pitchbook’s De-SPAC Index which tracks public performance of de-SPAC combinations after mergers reported a 78% decrease since March of 2021.
According to SEC rules, SPACs have only two years to merge with a target company after listing, and at most it can be extended to three years. If this deadline is missed, the SPAC must be shut down and liquidated. As many deadlines are coming up in 2023 for those SPACs listed in 2021, the outlook for many SPACs is bleak. Pitchbook reports that from December 2022 through January 2023, 100 SPACs have been shut down and liquidated and analysts suspect this number to continue to rise throughout the year.
Data Source: Bloomberg, BBC, Charles Schwab, CNBC, the Daily Shot HFR (returns have a two-day lag), Jim Bianco Research, Market Watch, Morningstar, Pitchbook, Standard & Poor’s, Morgan Stanley, Goldman Sachs and the Wall Street Journal.