
Economic Data Watch and Market Outlook
Global equities continue to be under pressure as Russia continues to threaten to invade Ukraine. Some speculated that Putin would wait until the Olympics were over as not to overshadow China’s presences on the global stage. Despite that Developed Market equities still fell 1.86%. Over the weekend, there seemed to be some movement as the US and Russia agreed in principle to have a summit so long as Russia does not invade. With that said as of the writing of this piece Monday afternoon, there seems as if there is little hope that Putin backs down as he signs decrees ordering military forces into two separatist regions of the Ukraine.
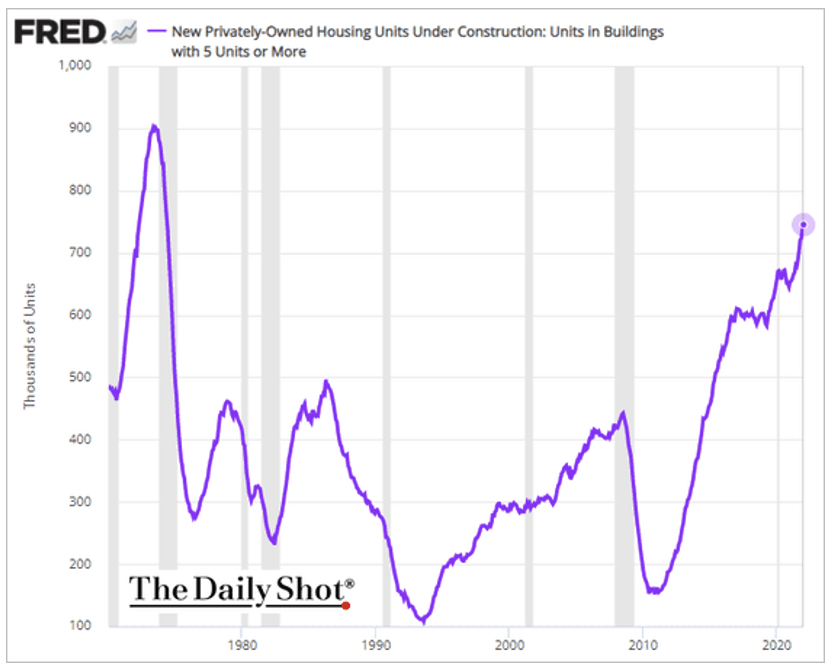
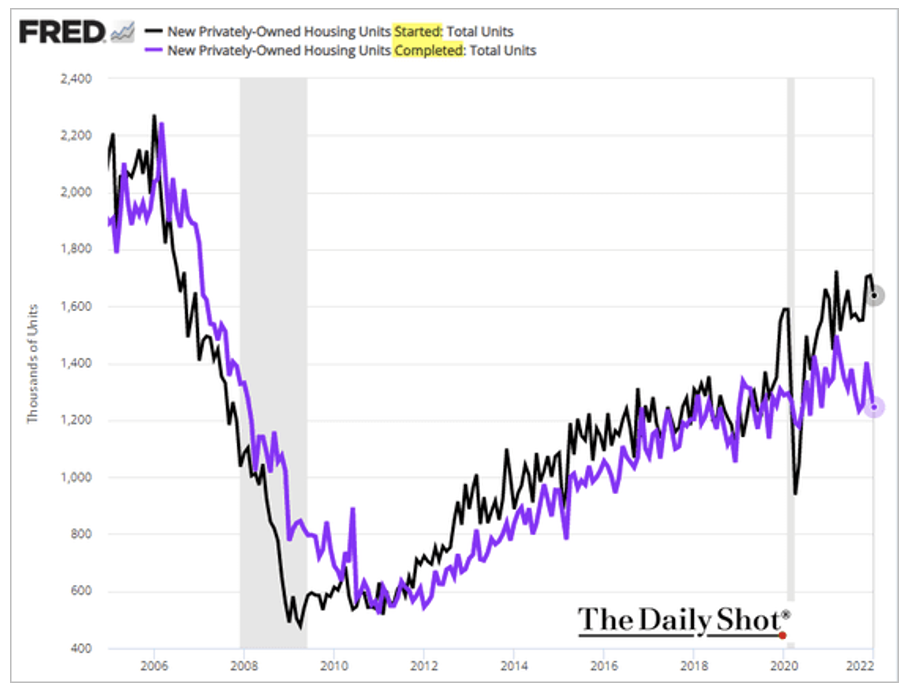
This week we’ll see a variety of price data including data related to housing. Several weeks ago, we noted that housing rental prices were increasing dramatically and the number of available rental units was declining. Below we can see that there is an attempt to address this, but there is some divergence between units started and completed.
Continued anxiety related to inflation and the Fed’s intervention(s) also put pressure on equities and bonds. The Russell 1000 fell 1.66% while the US Aggregate Bond Index fell 24 basis points. Inflation is developing outside of the US as well, especially in emerging Asian countries such as India where the latest result was 6%, and the trend had been 3.6%.
Equities
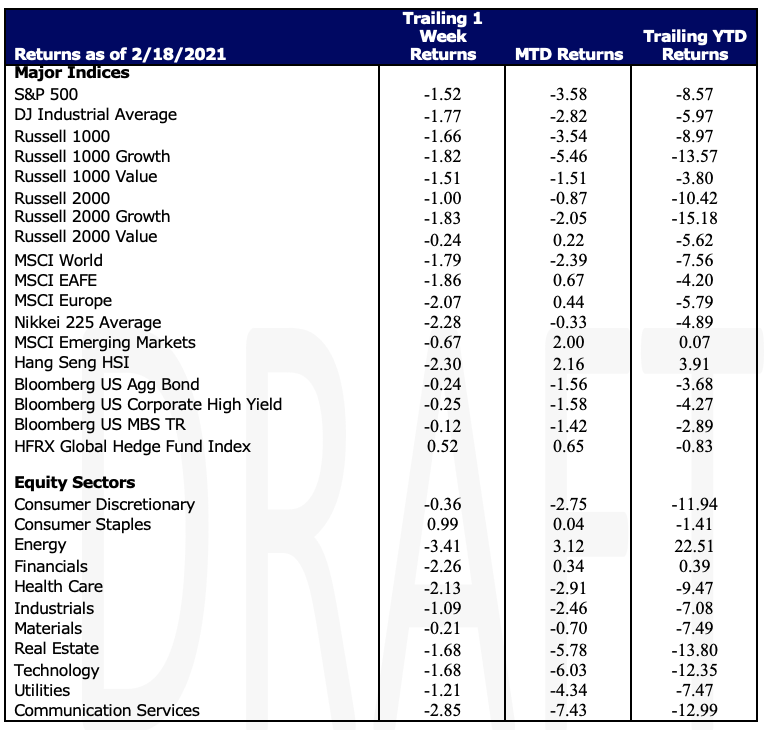
Stocks had their second week of consecutive declines due to ongoing tensions between Russia and the Ukraine with the S&P 500 falling 1.52%. High inflation also added to negative investor sentiment. Walmart earnings were positive this week helping the S&P 500 Index while negative talk around Meta Platforms had the opposite effect. Adding onto Walmart’s positive news – U.S. retail sales data was released and rebounded from a decline in December as online purchases and furniture sales grew in January. The January Fed minutes were released and contained no new details on rate hikes; arguably a positive for investors looking for no material surprises. Small cap stocks were the relative winners for the week as the Russell 2000 fell ‘just’ 1%. The slide in growth stocks continues as the Russell 1000 Growth index is down 15.18% on a YTD basis. The Russell 1000 Value is down 5.62% year-to-date.
Stocks in Europe and Japan declined on the week ( -2.07% and-2.86% respectively) due to geopolitical tensions.
Fixed Income
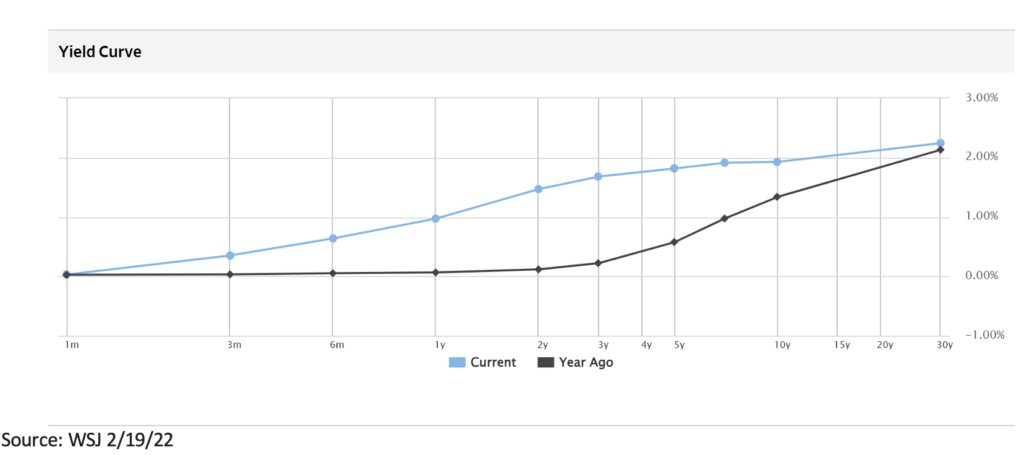
Markets continue to digest the situation that is escalating between the Ukraine and Russia. Treasury yields saw an initial rise followed by a 3-day decline to close out the week. On Wednesday the 2-year note dropped 5 basis points, which is the biggest single day drop in over a month. As the week ended, the 2-year note closed at 1.47%, the 10-year note closed at 1.92%, and the 30-year bond closed at 2.24%. Muni rates saw their highest yields since April 2020 with 5-year GO bonds reaching 1.45% and 10-year reaching 1.69%. Corporate spreads widened with new issuance reaching $27 billion, exceeding expectations. Corporate bond issuance seemed unphased by the current geopolitical issues but driven by an urge to beat the Fed’s possible rate hike in March. High yield reacted in the opposite way amidst the global unrest slowing new issuance. The asset-backed securities market hit a new high in weekly issuance year to date with over $11 billion. The 2022 ABS market has seen a total YTD supply of more than $42 billion new issuance which is roughly 1.5 times faster than last year.
Hedge Funds
Flows for the week were mixed with North America and Asia ex-Japan net bought and Europe and Japan net sold. In North America, the net buying was driven by financials and energy, both by adding to longs outpacing covering of shorts. Healthcare was also net bought driven by medtech. That changed on Thursday with the market pullback and funds added to shorts, bringing net leverage down to 48%, the lowest since June 2020. At the factor level, funds were net buyers of volatility and net sellers of quality. In AxJ, the buying was predominantly concentrated in China (ADRs). In Europe and Japan, hedge funds reduced gross exposure on both sides of the book and were net sellers in both regions (much of the Europe selling was in ETFs and materials while Japan was more widely dispersed). Net exposure in Japan fell to the lowest levels in a decade. Hedge funds posted losses as of Thursday with most funds’ losses in line with equity indices. Managers are increasingly hedging credit exposure through ETFs, while positioning in high yield sensitive stocks remains extended amid rising risk of deteriorating credit conditions.
Private Equity/Private Credit/Venture Capital
In 2021 private debt managers raised $191.2B, a notable 12.1% year over year gain and the second highest annual total on record. In terms of AUM, private debt is now the third largest private market strategy behind private equity and venture capital. Analysts accredit the increased funding to a variety of factors including negative yields on government bonds, lower than expected default rates, accommodative monetary and fiscal policy and the positive recent performance by private debt as an asset class.
Growth of this asset class as well as the growth in private equity is presenting an increasing opportunity for managers as leveraged buy outs often rely on privately arranged financing instead of traditional high-yield bonds or bank syndicated loans. Fund sizes are also increasing to meet the growth with a median direct lending fund size of $900M in 2021. Analysts suspect private debt fundraising and AUM to continue to grow, however at a slower rate given interest rate increases over the medium term.
Data Source: Bloomberg, CDC, CNBC, the Daily Shot HFR (returns have a two-day lag), Financial Times, Morningstar, Pitchbook, Standard & Poor’s, US Census Bureau, the Wall Street Journal, Yardeni Research, Morgan Stanley and Goldman Sachs Capital Introduction and IR+M
| This report discusses general market activity, industry, or sector trends, or other broad-based economic, market or political conditions and should not be construed as research or investment advice. It is for informational purposes only and does not constitute, and is not to be construed as, an offer or solicitation to buy or sell any securities or related financial instruments. Opinions expressed in this report reflect current opinions of Clearbrook as of the date appearing in this material only. This report is based on information obtained from sources believed to be reliable, but no independent verification has been made and Clearbrook does not guarantee its accuracy or completeness. Clearbrook does not make any representations in this material regarding the suitability of any security for a particular investor or the tax-exempt nature or taxability of payments made in respect to any security. Investors are urged to consult with their financial advisors before buying or selling any securities. The information in this report may not be current and Clearbrook has no obligation to provide any updates or changes. |