
Economic Data Watch and Market Outlook
Despite strong economic data and corporate earnings early in the week, a higher-than-expected inflation print, and its potential impact on Fed decisions, weighed on markets. US equity markets (S&P 500) fell 1.79% adding to the poor returns in January. The weakness later in the week was due to the US CPI rising 7.5% YoY in January, the fastest pace in 40 years; the 0.6% month-over-month increase was driven by food, energy and shelter. Consumers seemingly can’t catch a break as supply chain issues caused by COVID continue to keep prices elevated. Despite cases dropping significantly in the US, spikes have occurred in Asia which could continue to hinder shipments of goods to the US. Additionally, truckers in the US and Canada are protesting against Covid mandates by blocking major arteries between the two countries, most notably the Ambassador Bridge between Detroit and Windsor. Ford, GM, Toyota and Honda slowed down manufacturing at US plants as a result. Forbes reports that roughly $140 million in cars and parts are exchanged everyday via this bridge.
As of this writing, reports of a Ukraine invasion by Russia was expected to be imminent. Is the intent of Putin to actually invade, to posture to advance his own profile, and/or damage Ukraine’s economy? The European Union depends heavily on Russia’s natural gas. According to Eurostat, Russia accounts for roughly 38% of the EU’s natural gas. For context, the Czech Republic relies on them for 100% of its supply, Germany, the EU’s largest economic power, 65%, France just under 16%. Vocal physical support for Ukraine seems to inversely correlate with the amount of gas received from Russia. Nat gas is slightly offset by liquified natural gas coming from the US in tankers so large one shipment can heat 70,000 homes for a year according to a recent NY Times article. Perhaps it’s much to do about nothing. European equity markets seemingly shrugged off the possibility during the week if equity markets are an indicator, rising 1.26%.
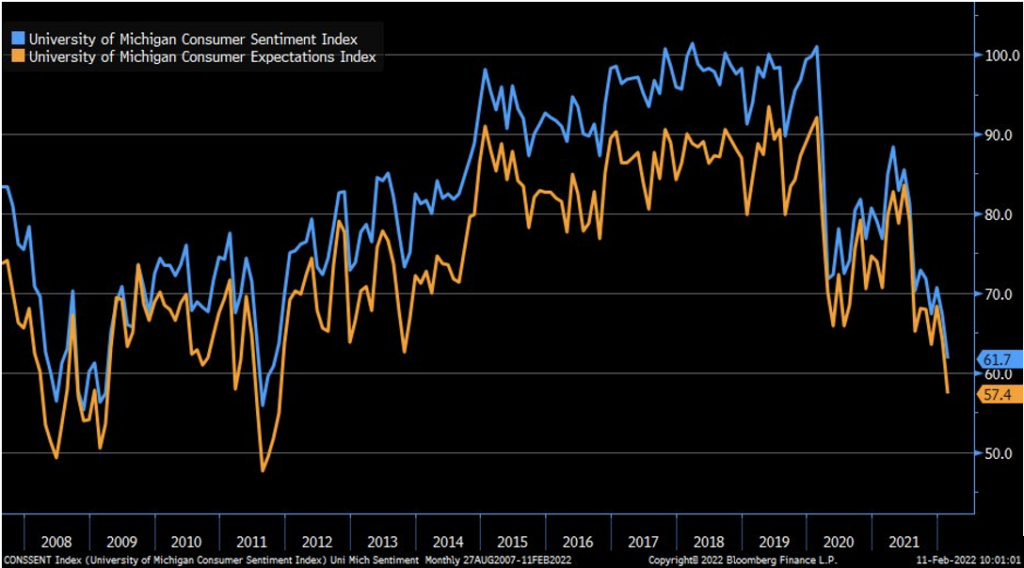
Essentially investors are at the fork in the road: Do you fear inflation and avoid risk assets or do you have faith the FOMC will be judicious in their actions and slowly raise rates to offset inflation. US sentiment seems to indicate the former as the Friday’s release of the University of Michigan Consumer confidence survey hit a 10-year low.
As we have discussed previously, good news can be bad and vice a versa. Right now, earnings are being overshadowed by the potentially diluting effect of higher interest rates and the futures market is pricing in a very aggressive series of tightenings.
Equities
The S&P 500 dropped 1.79% for week while small cap Russell 2000 gained for the week, rising 1.42% slightly recouping some of the YTD losses (-9.51 YTD). The Growth versus Value disparity continued to widen in 2022 (R1000 Growth -2.62 vs R1000 Value, -0.45%) as Energy and Financials were positive during the week, 2.62% and 0.02%, respectively. These two sectors are the only sectors that are positive on a year to date basis and have helped widen the growth value disparity on a YTD basis (-11.97% versus -2.33%). The Growth/ Value gap YTD is about 10% wider than in large caps ( -13.97% versus -5.39%).
Despite the lack of confidence by US consumers, noted by the University of Michigan Survey data, indicates that non-US investors are more confident in the US economy, capitalizing on volatility in US equity markets “buying the dip” as indicated by the chart below.
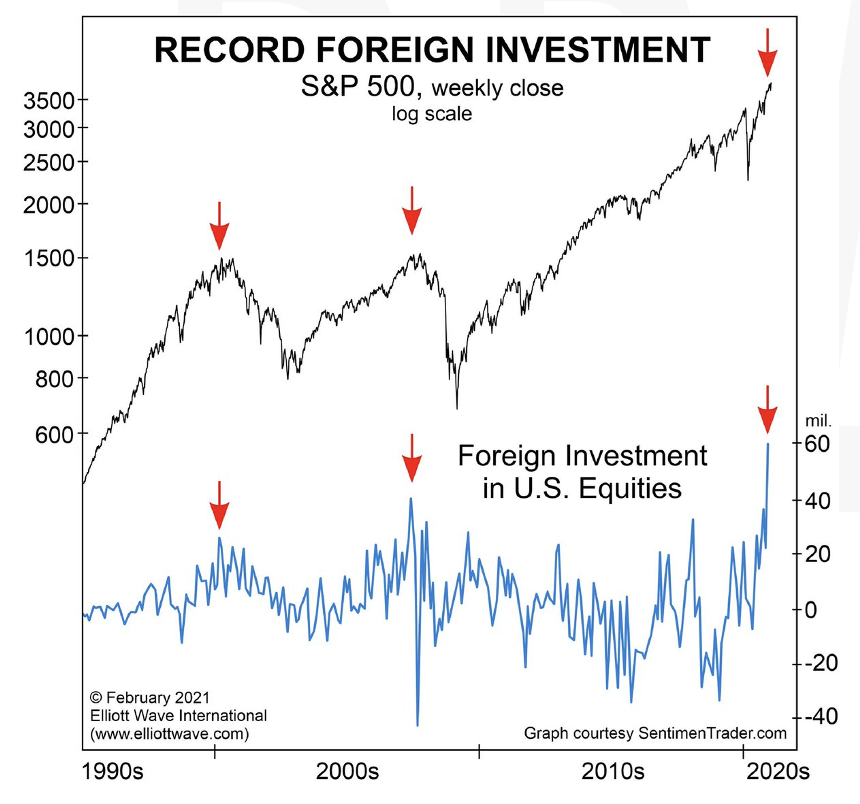
The inflows are interesting given that valuations of non-US companies look attractive relative to US stocks. Developed markets were positive last week, 1.42%, and are down roughly 2.4% on a YTD basis. Emerging markets were up 1.6% on the week and 0.75% YTD
Fixed Income
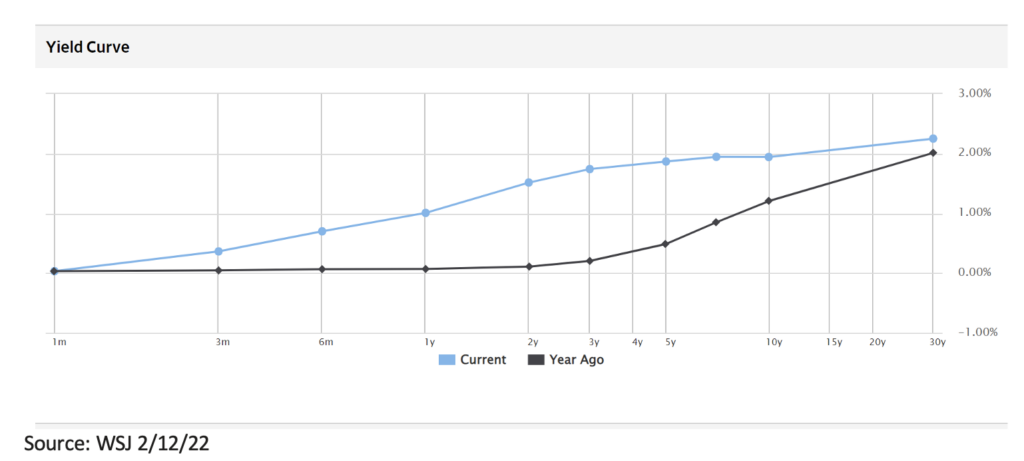
Treasury yields rose due to a combination of January’s CPI increase and tension increasing on the Ukraine border, causing a selloff in stocks and movement into government bonds. The 2-year treasury note ended the week at 1.516%, up 20 basis points from Monday’s open. The 10-year treasury note broke the 2% mark this week which is the first time since 2019 but closed at 1.943%. The U.S. 30 Year Treasury Bond closed the week at 2.251%. Following Thursday’s CPI release, investor outlook towards a Fed rate hike to reach at least 1.75% by year end strengthened, with the March meeting looking like a possible 50 basis point raise.
The municipal bond market was hit hard this week with over $4 billion leaving the space which is the largest decrease since the beginning of the pandemic in 2020. The Bloomberg US Corporate High Yield Total Return Index dropped .9% as investors seem to be fleeing the traditional high yield sector and moving into floating rate funds following the rising rate sentiment that the market has been facing. Corporate spreads tightened slightly during the week and the 2022 CMBS market has already tripled its pace of issuance year to date compared to last year with 22 billion issued.
Hedge Funds
Despite index level pull-backs on Monday and Thursday (hedge fund data is from Friday to Thursday), North American hedge funds were the top performers relative to their index this week compared to the other regions but YTD still lag the other regions with the S&P’s continued underperformance. Long/short ratio remains the lowest since July 2020. Amid a stronger than expected CPI print and higher bond yields, rate sensitive financials were bought driven by both long buying and short covering. EU-based hedge funds lagged all regions this week despite the Euro STOXX rising 2.2% but lead all regions YTD. China long/short funds were the second-best performers as the MSCI China Index rose 2.4% this past week. Crowded longs outperformed in all regions this week. This week’s spread between crowded longs and the S&P is on pace to be the best week since mid-July 2021. Crowded longs in Europe were up 3.1% vs. 1.4% for crowded shorts. YTD the spread between crowded longs and shorts in Europe is 5.5%, representing the best spread going back to 2016. North American equities were the most net bought of all regions with both long buying and short covering. In other regions, hedge funds were net buyers of the region driven by long buying. Hedge funds were marginal net buyers of Asia ex-Japan with long buying narrowly outpacing short additions. Japanese equities were the only region to be net sold.
Private Equity
As more GPs move to hold investments longer by rolling them into new follow-on funds, the secondaries market is seeing a resurgence of activity. Total secondary deal volume in 2021 was $132 billion, breaking the record of $88 billion set in 2019. In 2021, continuation funds accounted for 84% of GP-lead transactions and analysts suspect 2022 will surpass 2021’s record.
Historically, such transactions were used to move unrealized portfolio investments out of a fund that was at the end of its lifespan. This often indicated that an investment was in distress and unlikely to return capital. However, today this is no longer the case as continuation funds are being used as means to extract more value from the highest performing assets. This strategy is not only being used by buyout funds, but also by growth equity investors and venture capitalists.
The increased adoption of continuation funds comes at a time when more and more GPs are searching for new ways to align conflicting goals of holding on to high performing assets longer and managing liquidity targets across existing funds. Continuation funds are providing GPs with liquidity options as they increase the ratio of distributions over paid-in capital on existing funds.
Data Source: Bloomberg, CDC, CNBC, the Daily Shot HFR (returns have a two-day lag),Financial Times, Morningstar, Pitchbook, Standard & Poor’s, US Census Bureau, the Wall Street Journal, Yardeni Research, Morgan Stanley and Goldman Sachs Capital Introduction and IR+M
| This report discusses general market activity, industry, or sector trends, or other broad-based economic, market or political conditions and should not be construed as research or investment advice. It is for informational purposes only and does not constitute, and is not to be construed as, an offer or solicitation to buy or sell any securities or related financial instruments. Opinions expressed in this report reflect current opinions of Clearbrook as of the date appearing in this material only. This report is based on information obtained from sources believed to be reliable, but no independent verification has been made and Clearbrook does not guarantee its accuracy or completeness. Clearbrook does not make any representations in this material regarding the suitability of any security for a particular investor or the tax-exempt nature or taxability of payments made in respect to any security. Investors are urged to consult with their financial advisors before buying or selling any securities. The information in this report may not be current and Clearbrook has no obligation to provide any updates or changes. |