
Economic Data Watch and Market Outlook
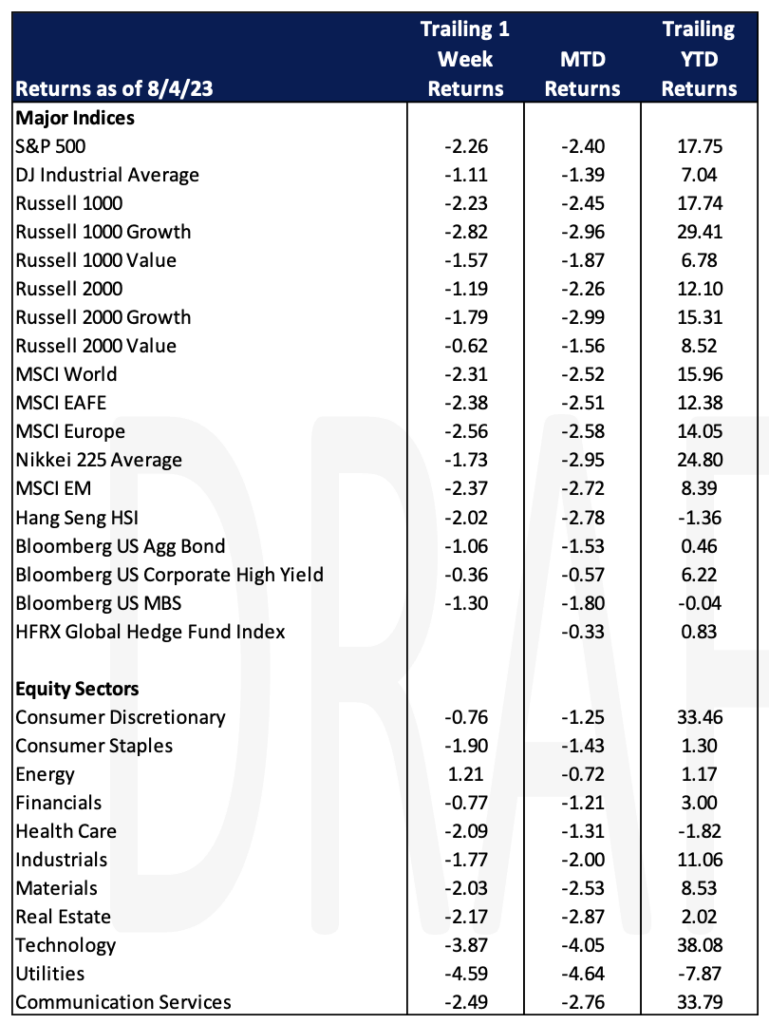
In last week’s note, we mentioned that earnings calls were more optimistic about the probability of a soft landing or no recession. Investors should keep in mind that the stock market does not always replicate the economy. This week, global equity markets were down over two percent as investors increasingly became more concerned about valuations. The MSCI World, MSCI EAFE, MSCI EM, and the S&P 500 fell 2.31%, 2.38%, 2.37%, and 2.26% respectively. The Bloomberg Aggregate Bond benchmark fell 1.06%.
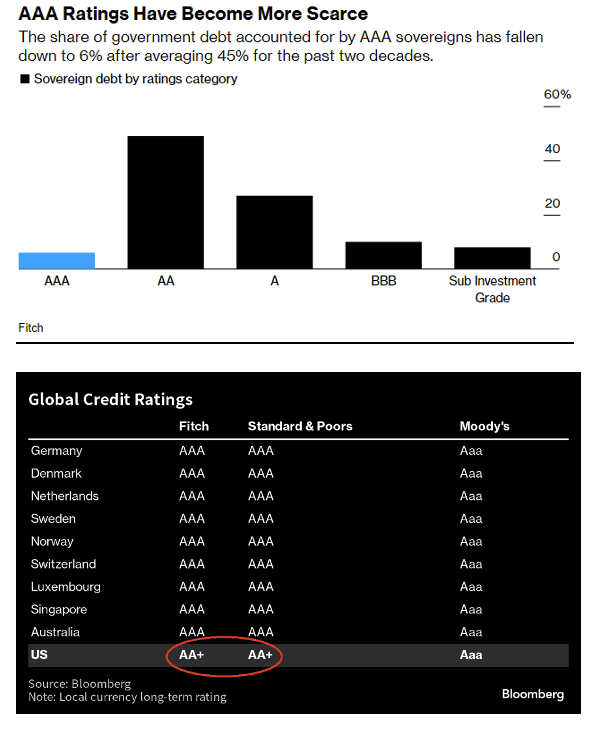
Some of the week’s asset price declines can be blamed on the downgrade of US government debt by Fitch. The US lost its AAA rating marking a trend seen over the last decade in developed economies due to concerns about high and increasing debt burdens. Fitch’s AAA-rated nations now number nine, just 6% of global government debt, down from 41%. This highlights the declining public finances of major economies, especially following increased government spending post the global financial crisis and the pandemic. While demand for US Treasuries remains strong, the downgrade raises concerns about fiscal responsibility and the potential negative impact on growth due to escalating debt service crowding out investment.
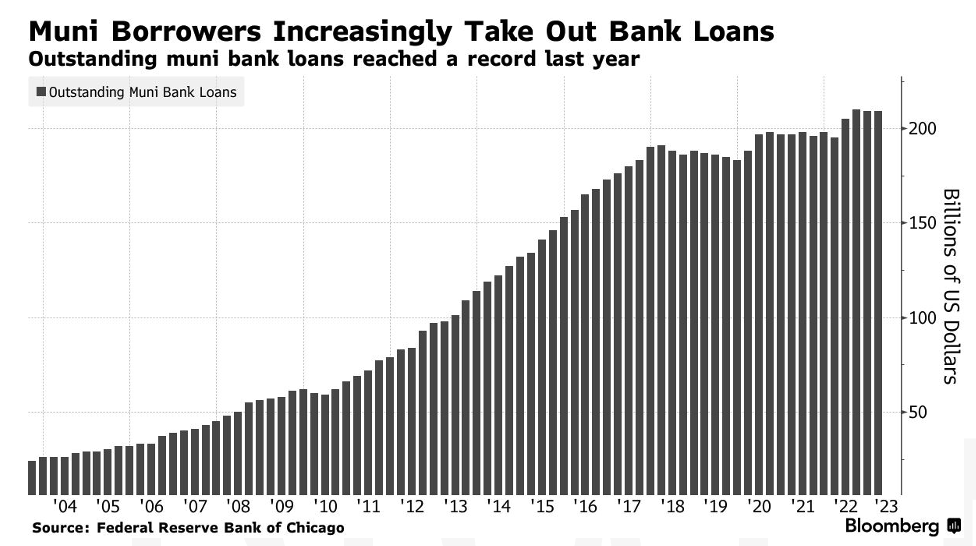
State and local governments are turning to banks for capital during times of financial stress and market volatility. Outstanding municipal bank loans are just $1B under their record of $210B reached in 2022 according to the Federal Reserve Bank of Chicago. Instead of issuing debt to public markets US governments are instead raising money through banks as they did during the GFC and Covid-19 pandemic. Bank loans provide borrowers with more financial flexibility than municipal bond markets. Bank debt is more attractive to government borrows that have stable revenue but are facing higher borrowing costs, credit downgrades, and a reduction in bond market access.
Employment data was robust for the most part except for the ISM manufacturing employment data released on Tuesday which came in lower than expected. ADP results are typically much more volatile than government data and came in much higher than forecast. Average hourly earnings came in slightly higher than forecast and the unemployment rate dipped slightly. After the recent move this week in the S&P 500 the index is trading at a 19.7x price -to-earnings ratio, which is higher than the five-year average of 18.6x. The market reacted positively Friday following the job release that US employers added 187,000 jobs in July.
Saudi Arabia announced Thursday that it will continue its cut on oil production. Extending a one million barrel per day reduction through September. Oil futures rose on the announcement, reclaiming losses from the previous session. Although Saudi Arabian oil production only makes up seven percent of US crude imports, the reduction of one million barrels per day tightens global supply. Gas prices have risen from $3.545 a month ago to $3.821 per gallon on Tuesday, according to AAA.
The upcoming week the US will release CPI data on Thursday and PPI on Friday.
Equities
Following the downgrade of America’s credit stocks sold off broadly Thursday with the S&P 500 falling 1.4% and the NASDAQ saw its worst one-day performance since February falling 2.2%. The Dow Jones Industrial Average fell one percent, impacted by poor performance from Intel and Microsoft. The declines also rippled through markets in Europe and Asia following the downgrade. Jamie Dimon, chief executive of JPMorgan Chase, commented positively saying the downgrade should not be too concerning and that the US has the “best economy the world has ever seen”.
As investors digest a wave of earnings investors have set the bar quite high as AMD saw a sell-off this week following estimate beats on both quarterly sales and earnings. Nvidia and Micron also dropped 4.8% and 3.7% respectively Tuesday. AMD is looking to rival Nvidia as they are developing a new class of GPUs designed for artificial intelligence which is used in data centers. A few months ago, the company announced it expects its data-center revenue in the second half of 2023 to jump 50% compared to the first half of 2023. In its earnings call it was mentioned most of those gains will come from the fourth quarter when it releases its new GPU chip. Analysts are expecting a 37% increase in data-center revenue for AMD in Q4 which is the largest since launch in 2021.
Source: DataTrek Research
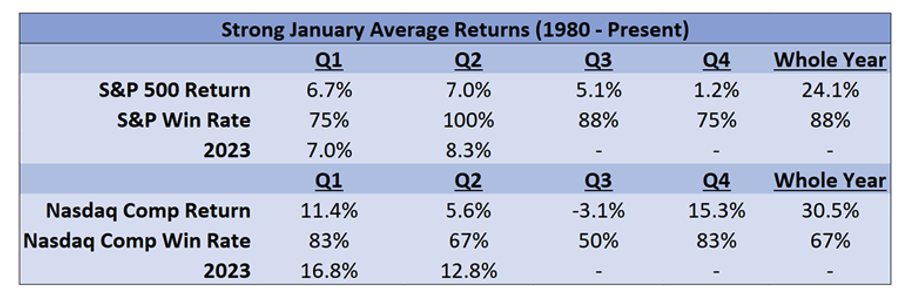
The averages of the S&P 500 and Nasdaq for January historically since 1980 have been 0.9% and 2.3%. One standard deviation above these returns puts the S&P 500 return at 5.5% and 8.5% for the Nasdaq. Excluding this year there have been eight years since 1980 when the S&P 500 has returned over 5% or 20% of the time. The Nasdaq composite had six years since 1980 where it exceeded 8.5% or 14% of the time. The S&P 500 years were 1980, 1985, 1987, 1989, 1997, 2013, 2018, and 2019 while the Nasdaq years were 1985, 1987, 1991, 1999, 2001, and 2019. From the data, Nasdaq performs better in H1 but both perform positively. Years where there has been strong January performance the Nasdaq does tend to have a weaker Q3 while the S&P produces historically strong returns in Q3. Nasdaq numbers show an average Q3 return of (-3.1%) while the S&P 500 returned 5.1%. Nasdaq tends to perform better in Q4 comparatively.
Source: DataTrek Research
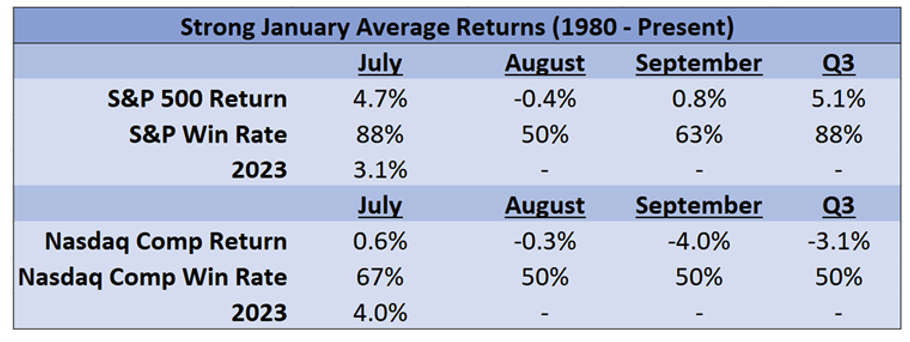
Diving deeper into Q3 the S&P is almost always positive in July during these years and was the case again last month. Both have seen historically negative returns for August while the Nasdaq has seen negative returns in September vs the S&P 500 being relatively flat historically, 0.8%.
Flights within the US are down this summer as JetBlue cut its earnings forecast for the year and had some concerns about a loss in Q3. They are not the only airline to feel some pressure as Alaska airlines also slashed fares while Southwest and Spirit held some flight promotions signaling some struggle in the industry. Outside the US airlines have seen growth in sales and prices on flights remain high, up 10% from last year and 26% compared to 2019 according to Hopper. Flights domestically have seen round trips decline in sales by 11%. On a more positive note, the airline industry Global Jets ETF symbol JETS has seen some strong performance in the last three months and year-to-date is up roughly 18.6% as travel has picked up.
Apple recorded its third straight revenue decline as iPhone sales have lagged while the services unit has been positive as it hit a record $21 billion in sales. Amazon quarterly earnings nearly doubled what analysts were expecting. Analysts signaled that Amazon’s job losses have helped the company following a tough 2022 where they said they had laid off more than 27,000 employees. Revenue rose by roughly 11% and the company expects a similar expansion for the current quarter.
Fixed Income
Treasuries saw mixed performance this week with the 2-year Treasury yield falling 9 bps, the 10-year treasury yield climbing 9 bps, and the 30-year Treasury yield rising 18 bps. Meanwhile, major bond indices fell. The Bloomberg US Aggregate Bond Index fell 1.06%, the Bloomberg US Corporate High Yield Index fell 0.36%, and the Bloomberg US MBS Index fell 1.30%. Labor market data Friday showing that the US added 187,000 jobs last month, adding to the case that the labor market is cooling and that we could be coming to the end of this rate hike cycle. The CME FedWatch Tool, which uses Fed Funds’ futures prices to display current and historical probabilities of rate hikes or cuts is now showing an 87% probability that there will be a pause at the next FOMC meeting in September.
On Tuesday credit rating firm Fitch Ratings downgraded the US government’s long term foreign currency default rating from AAA to AA+. Fitch said Tuesday that the downgrade reflects “the expected fiscal deterioration over the next three years, a high and growing general government debt burden and the erosion of governance relative to AA and AAA rated peers over the last two decades”. The White House pushed back on the downgrade, with Janet Yellen saying that the move was arbitrary and based on outdated data. Moody’s Investor Service is now the only major rating agency that holds the US at AAA. Standard & Poor downgraded the US in 2011.
Hedge Funds
Performance this week was more challenging for hedge funds (HFs) given the sell-off in equities on Wednesday. Through the first three days of August, relative performance for the average global HF was fairly strong declining ~ 65 bps, which compares to the MSCI AC World Index down -2.5%. When looking at long/short equity (L/S) performance, the relative returns were slightly worse given they were running net exposure on the higher side vs. relative to recent history. They also were heavily exposed to tech which ranked among the worst performing sectors. For the week, the average Americas-based L/S equity fund is down 1.4% which compares to the S&P down 1.9%. In other regions, EU-based HFs hung in well as they were down only ~ 30 bps on average while Asia-based managers were down the most (average fund down 1.4%).
After approximately two months of consistent de-grossing, the trend finally appeared to slow this past week as HFs added back to gross exposure across global equities. While the gross additions were pretty minimal in notional terms, it was the first sign of the de-grossing slowing since it began on June 7th. From a net perspective, HFs were sellers of global equities, with the selling spread across all regions. North American (NA) equities were ultimately the most net sold as HFs added to shorts while trimming long exposure, with a large portion of the net selling occurring on Wednesday. The net selling was spread across most sectors. Much of the focus this week was on the TMT space given the pullback in the Nasdaq on Wednesday, however, there wasn’t any outsized selling take place in TMT. Net flows were essentially flat as communications services was bought in small amounts which offset the small levels of selling seen in tech. On the short side, ETFs drove the bulk of the short adds and at the single-name level, healthcare, financials, and consumer staples saw the most short additions. Consumer discretionary was heavily net sold driven by both long and short sales. Outside of NA, HFs were net sellers of equities in Asia ex-Japan, Japan, and Europe. In AxJ, most of the selling was concentrated in China which offset >50% of what was net bought during the week ending July 28th. The selling of China this past week was split between ADRs and H-shares whereas A-shares were net bought in small amounts. Japanese equities saw the largest weekly net selling in nearly five months following YCC adjustments by the BoJ. In Europe, the selling was much more moderate, but this week was one of the larger weeks in terms of gross additions seen in several months (the 3rd largest both in terms of net long additions and net short additions). Flows at the sector level in Europe were much more muted with the exception of consumer staples which was the most net bought and communication services and tech which were both net sold.
Private Equity
Amidst challenging market conditions affecting overall US private equity dealmaking, growth equity investment activity has shown resilience. In Q2 2023, there were 336 growth equity transactions in the US, experiencing only a slight increase from Q1. In contrast, PE buyouts, including both big-ticket LBOs and smaller add-ons, faced a significant quarter-over-quarter decline of nearly 20%, as reported in PitchBook’s Q2 2023 US PE Breakdown.
Growth equity is now playing a more substantial role in PE dealmaking, accounting for 22.2% of total US PE deals in the first half of the year, approaching the previous record of 22.7% set in 2013. This trend indicates that growth equity deals may likely outnumber LBOs for the first time if the current pace continues.
The stability of growth equity can be attributed to US PE firms adopting investment strategies that require smaller check sizes and less leverage due to the scarcity of cheap debt financing. This approach enables growth equity to avoid the costly financing often associated with buyout strategies, making it more attractive amid softened public market valuations. Additionally, growth equity deals typically involve less pricing tension compared to buyouts, making it easier for buyers and sellers to agree on a price. In these transactions, valuation is just one of many variables at play, with negotiators also considering the projected positive outcomes of collaboration between the management team and the growth equity firm.
Despite these advantages, growth equity faces challenges, particularly in exits, as rising interest rates, portfolio valuation pressures, and weakened investor demand make exits more challenging. As a result, investment managers are becoming more selective on deals and focusing on helping portfolio companies grow profit margins rather than pursuing multiple arbitrage opportunities.
Despite these challenges, many investment firms have recently closed funds targeting growth equity opportunities, indicating continued interest in this segment. Goldman Sachs Asset Management raised $5.2 billion for investments in high-growth companies, and JP Morgan concluded its debut fund targeting Series B to pre-IPO companies.
Overall, growth equity investment has emerged as a stable and attractive option for PE firms amid uncertain market conditions and financing constraints, showcasing its resilience and potential for continued growth in the market.
Authors:
Jon Chesshire, Managing Director, Head of Research
Elisa Mailman, Managing Director, Head of Alternatives
Katie Fox, Managing Director
Michael McNamara, Analyst
Sam Morris, Analyst
Josh Friedberg, Summer Associate
Data Source: Apollo, Barron’s, Bloomberg, BBC, Charles Schwab, CNBC, the Daily Shot HFR (returns have a two-day lag), Goldman Sachs, Jim Bianco Research, J.P. Morgan, Market Watch, Morningstar, Morgan Stanley. Pitchbook, Standard & Poor’s and the Wall Street Journal.