
Economic Data Watch and Market Outlook
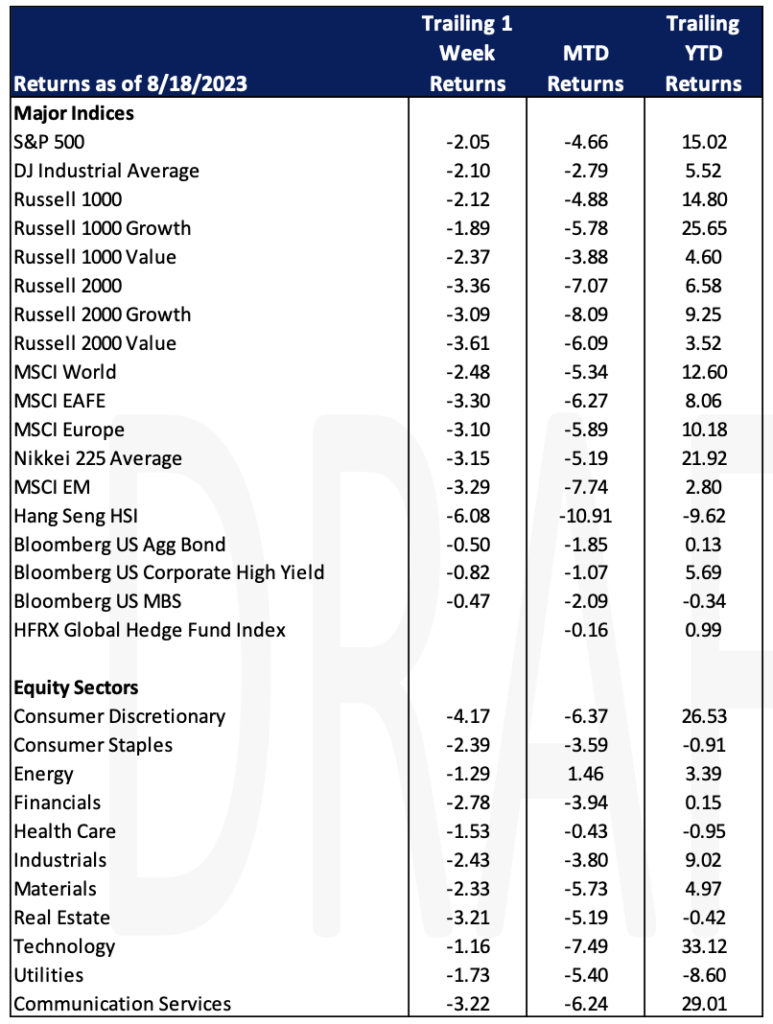
Global equity markets sold off this week on significantly lower volume with the US markets faring the best, dropping 2.05%. International developed markets, as represented by the MSCI. EAFE, fell by 3.30% and emerging markets declined 3.29%. The US Aggregate Bond Index fell 50 basis points as the US 10-year Treasury yield closed at 4.26% on Friday. For context, three years ago the 10-year Treasury was slightly above 50 basis points. The concern is that while inflation has seemingly cooled in some areas, it may not be cooling fast enough in others. For example, The Import Price Index, released on August 15th, fell 4.4% compared to expectations of 6.5%. On a month-over-month basis, import prices rose more than expected, 0.4% versus 0.2%.
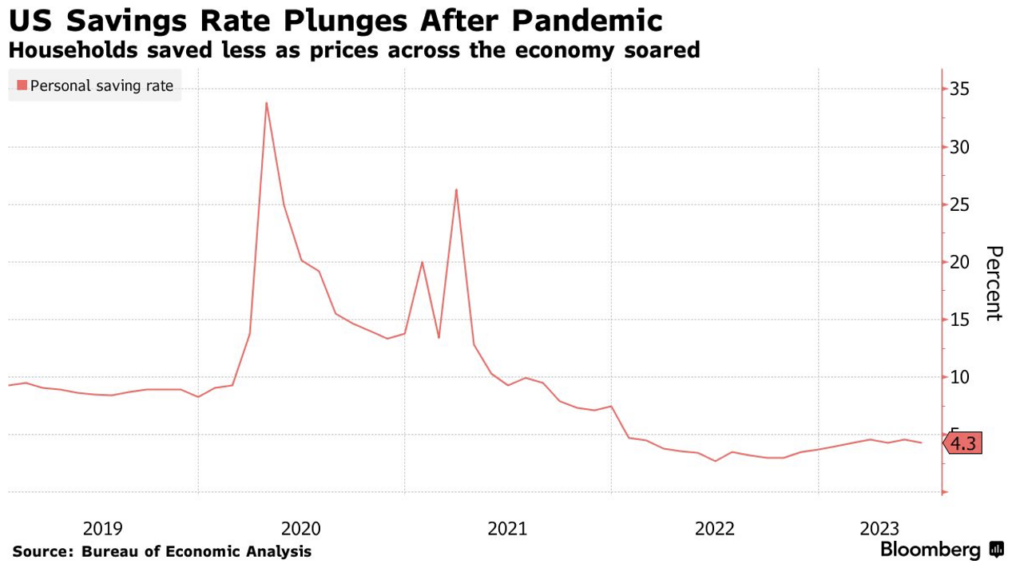
The Retail Sales results significantly surprised to the upside. The results in conjunction with import prices implied to traders that there may be possible rate increases coming and the week’s selloff in equities ensued. Month-over-month results were 0.7% versus an estimate of 0.4%. On a year-over-year basis they increased 3.17% versus the estimate of 1.5%. The Core Retail number, everything except autos, rose 1.0% while the consensus was for a 0.3% decrease. Further, over the last two years consumers have pulled over $2T from excess savings that were accumulated during the Covid-19 pandemic.
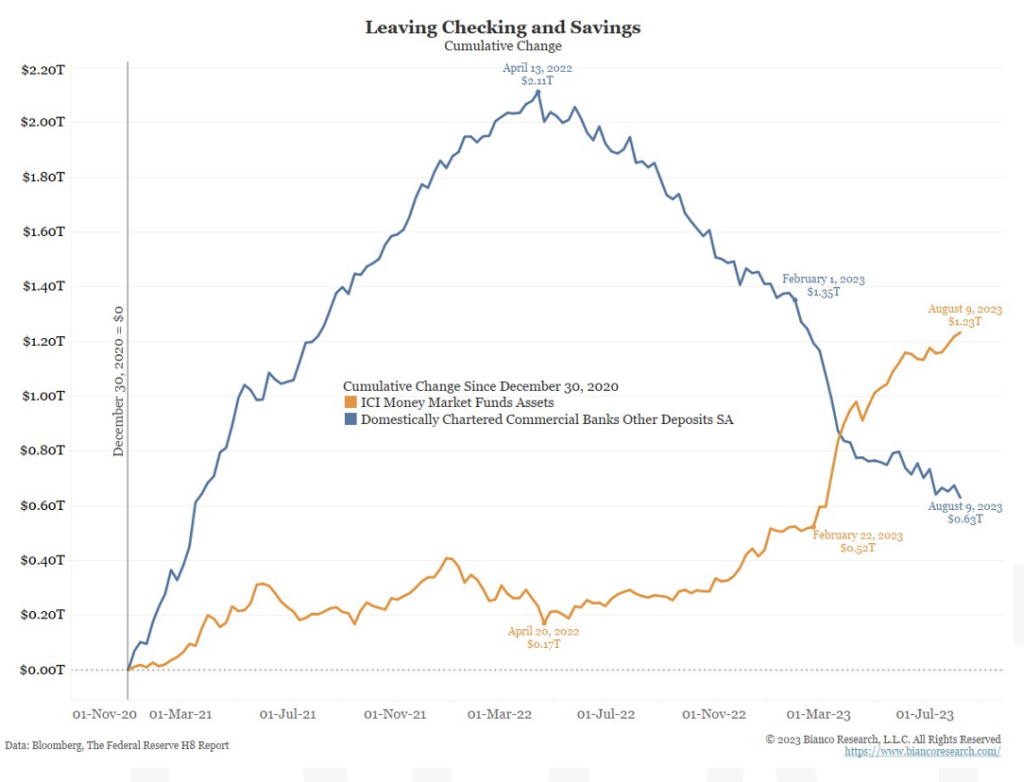
Those continuing to save have also continued to shift toward money market funds, away from bank savings programs as money market yields continue to be larger.
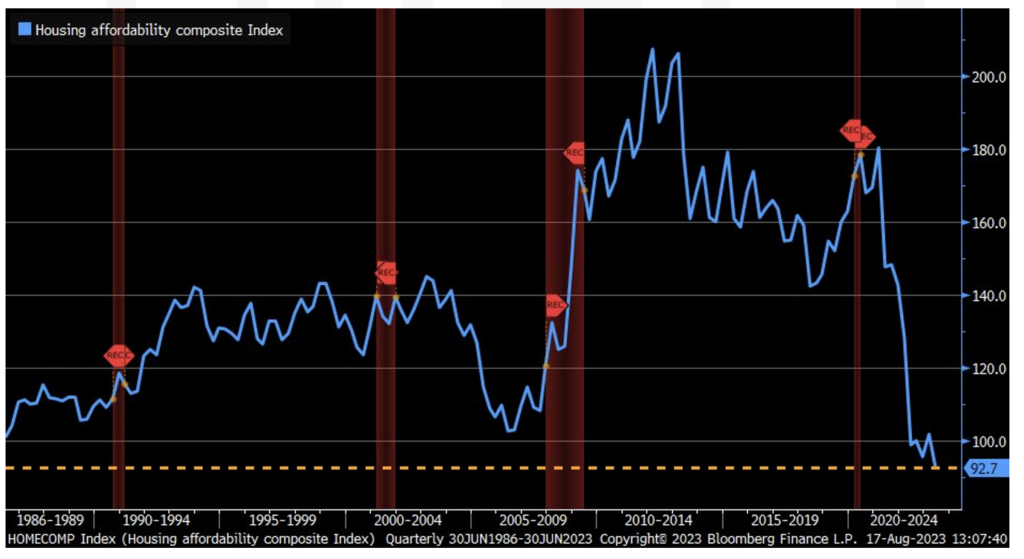
Mortgage rates hit a 20 year high of 7.09% this week according to Freddie Mac, climbing from 6.96% in the previous week. A year ago, the average 30-year fixed rate mortgage was 5.13%. This is the fourth consecutive weekly increase for the 30-year fixed rate mortgage and the highest level we have seen since April 2002. The National Association of Realtors measures whether or not a typical family could qualify for a mortgage loan on a typical home and hit its lowest reading on record.
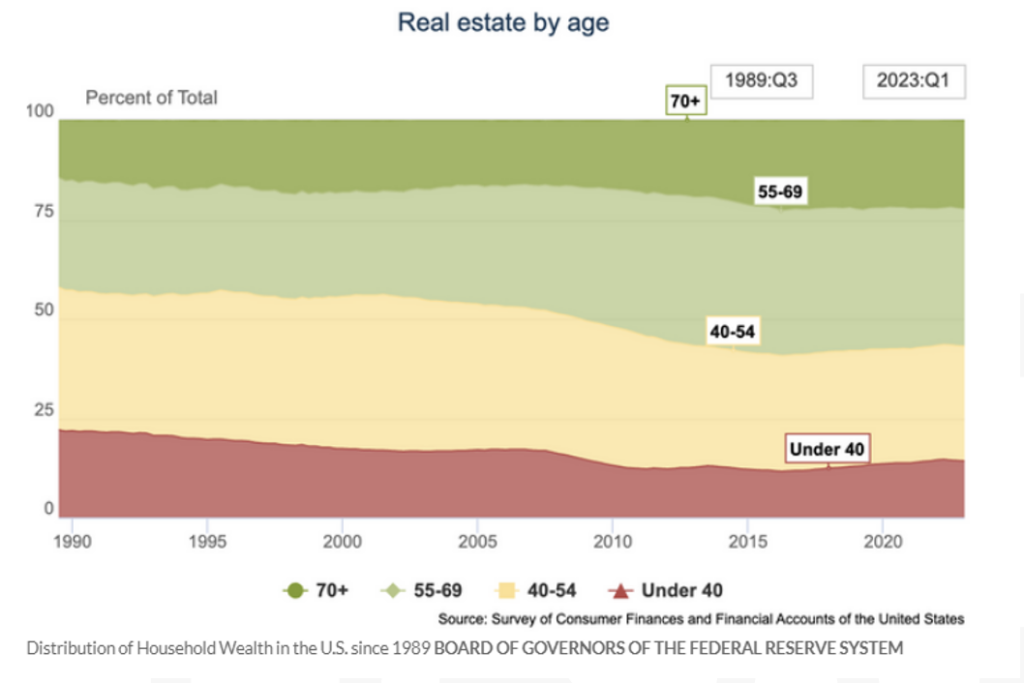
According to Redfin CEO Glenn Kelman, “Sales volume couldn’t be worse. The only people moving right now are the ones who absolutely have to.” Sales of previously owned homes fell by 3.3% to an annual rate of 4.16M in June, according to the National Association of Realtors. July data will be released in the coming week. Rising costs of homeownership are creating a disparity between generations, with baby boomers (born between 1946 and 1964) owning considerably more real estate in their 30s than the same age demographic today. In Q1 of 1993 20.6% of real estate was owned by those under 40. In 2023 homeownership of those under 40 has fallen to 14.2%.
The US will release housing data, durable goods orders for the month and Jobless claims but center stage will be the annual symposium hosted by the Kansas City Fed in Jackson Hole. The event will be attended by many of the world’s central bankers. Powell is slated to speak on Friday.
Equities
US equities were in the red during the week. Following the retail sales report for July, the S&P 500 fell below its 50-day moving average marking the first time since March 28th and closed at its lowest level since July 11th. This snapped a 96-day streak of closes above the 50-day moving average and the index’s longest since September 17th, 2020, when it broke a streak of 102 days closing above its 50-day moving average. Investors use this indicator as one to see the state of the index, but analysts still see a lot of room to fall before we start to worry about the index giving way to new lows.
In addition to the retail numbers for June, which were higher than expected, we also received a handful of earnings reports that can give us a bit of insight into the state of the consumer. Walmart’s report showed that the consumer is still spending cautiously. Sales and profit grew in Q2 as an increase in spending on necessities and deals continued. Lower sales of apparel and sporting goods did impact profits since those items tend to generate higher profits over groceries. The company also raised its full-year financial outlook and sales of groceries and health products increased from the prior year. Walmart executives said the consumer picture has improved since the start of the year as wages are strong and unemployment remains low. Shoppers continue to cook at home and spend cautiously. TJX reported Wednesday a 6% jump in sales and raised its sales growth and profit target for the year. TJX owns T.J. Maxx, Marshalls, and HomeGoods, whose brands are known for selling discounted goods. Management stated that the stores saw demand for their apparel and goods remain strong in Q2. Meanwhile, Home Depot and Target announced this week that sales fell during the quarter, but profits were stronger than expected due to the pent-up inventory from last year finally receding.
Major indices closed the week negative with the S&P 500 posting a decline (-2.05%) for the week, Russell 2000 fell (-3.61%), and the NASDAQ 100 dropped (-2.18%). Drilling into each sector specifically the biggest decliners during the week were consumer discretionary stocks followed by real estate and financials. The sector to see the least losses was technology followed by energy and healthcare.
Globally the same narrative continued as the MSCI World returned (-2.48%). Developed markets and emerging were relatively the same but still down roughly (-3.30%). European equities were slightly less negative but still saw losses. Chinese equities were a standout following some economic concerns as the Hang Seng fell (-6.08%). Investors continue to flee Chinese stocks due to more economic concerns. Thursday, investors sold 1.5 billion yuan worth of equities listed in Shanghai and Shenzhen which marked the 9th straight day of outflows. This marks the longest stretch of selling since Bloomberg began tracking the data in December of 2016. The surprise cut in the country’s benchmark lending rate and deterioration in the property sector also contributed to the equity sell-off this week. The reversal seen since the July 24th meeting by head party leaders to boost the economy has only added to the concerns around China both domestically and internationally.
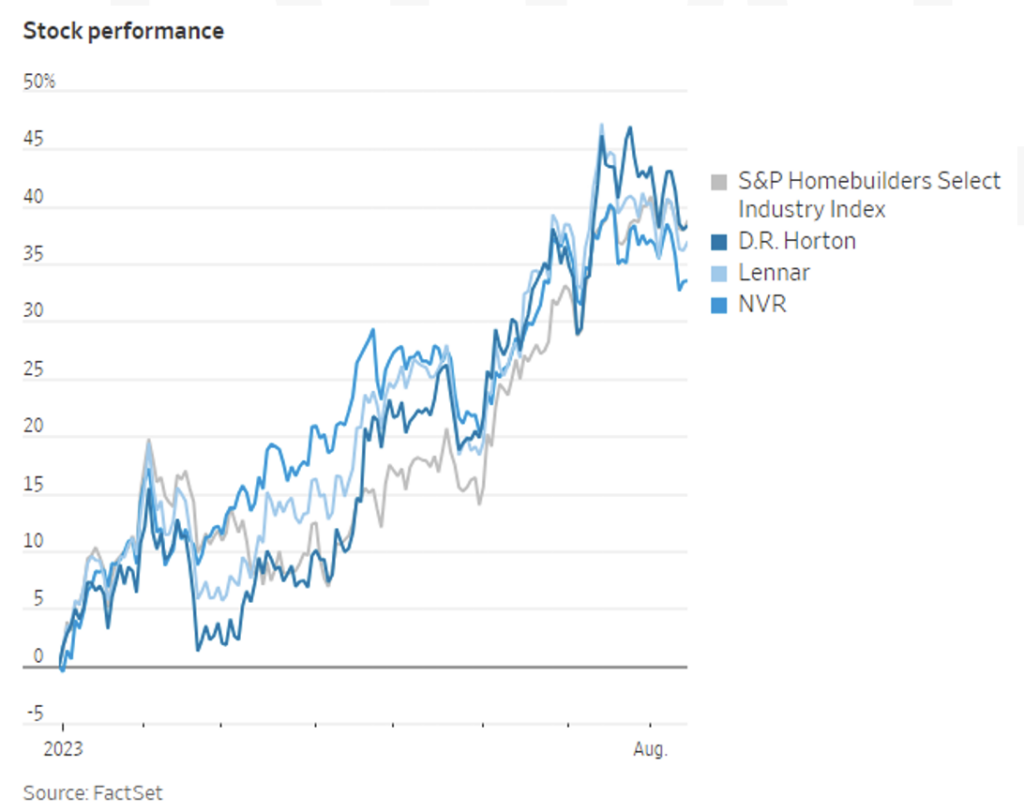
Berkshire Hathaway is betting on US home builders per their most recent 13F filing. The company unveiled new positions in D.R. Horton, NVR Inc, and Lennar, which combined were worth more than $800 million at the end of June. Lack of supply of available homes to buy is benefiting these homebuilding companies. Elevated rates are keeping homeowners from selling, which in turn leaves new construction as the next appealing option for new buyers. The S&P Homebuilders Select Industry Stock index is up 39% this year.
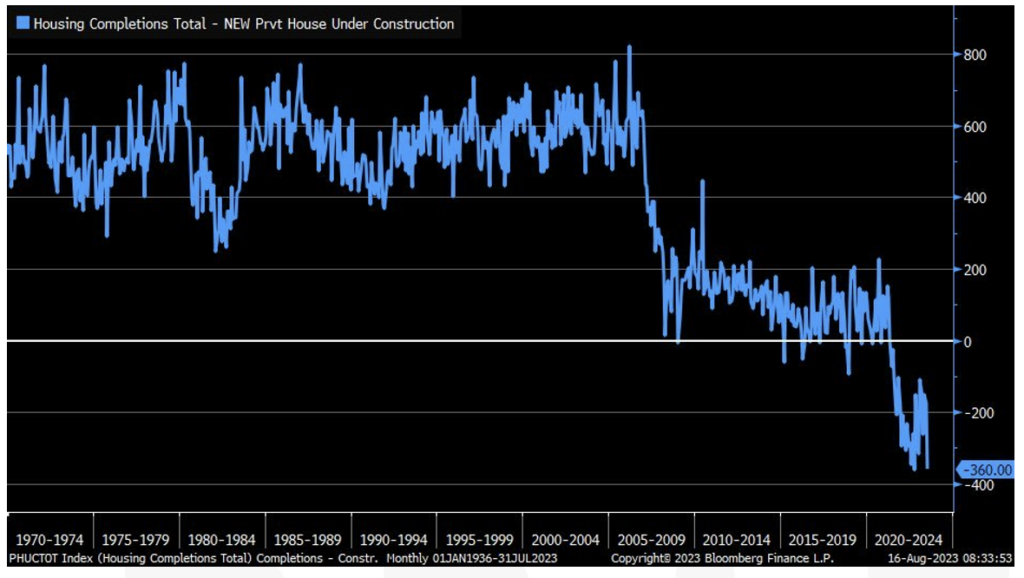
The demand for new homes will continue as the lag in homes completed versus those under construction lagged in July.
Fixed Income
Treasury yields on the longer end of the curve rose this week while yields under two years remained relatively flat. The 2-year Treasury yield rose 3 bps, the 10-year Treasury yield rose 10 bps, and the 30-year Treasury yield rose 11 bps. Meanwhile, the Bloomberg US Aggregate Bond Index fell -0.50%, the Bloomberg US Corporate High Yield Index fell -0.82%, and the Bloomberg US MBS Index fell -0.47%.
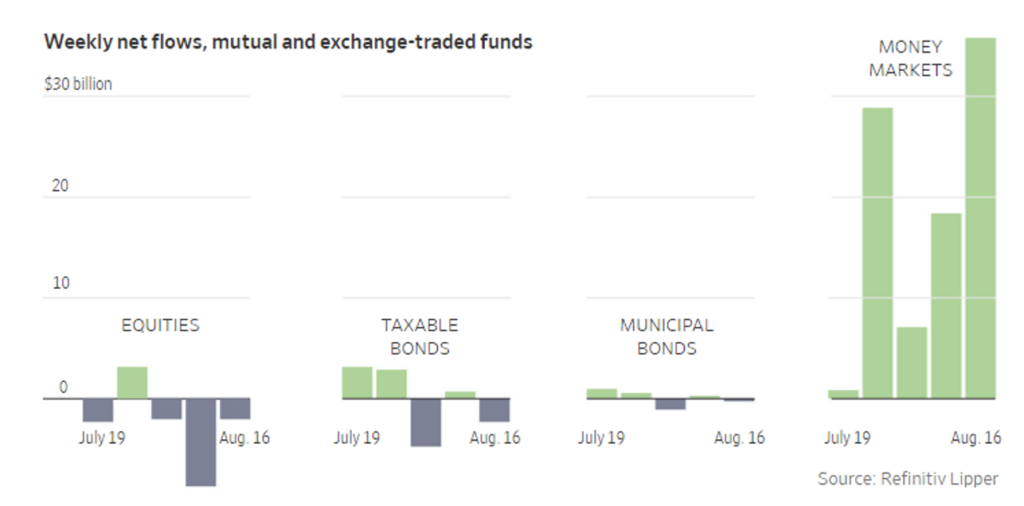
The trend towards money markets is continuing as investors flock to low-risk cash like instruments yielding a 5% return. According to Refinitiv Lipper data investors have pulled $11.6B out of equities on a net basis over the last 5 weeks, while money market funds have seen inflows of $91.1B over the same period. Retail money market funds have grown by more than 25% this year to $1.5T, with the average yield on the 100 largest taxable money market funds reaching 5.15% according to Crane data. This is the highest level since 1999. Speculative grade high yield bond funds such as the SPDR Bloomberg High Yield ETF and the iShares iBoxx High Yield ETF are yielding approximately 8% after fees. Despite these higher yields these funds have seen outflows of $11B so far this year on a net basis.
Hedge Funds as of Thursday, August 17th
Hedge funds (HFs) were able to limit losses to just a fraction of what global equity benchmarks were down this week amidst a challenging three-day stretch from Tuesday to Thursday. The average global HF ended the week down just 30 bps despite the MSCI falling ~2.3%, while Americas-based long/short (L/S) equity funds were down ~70 bps vs. the S&P down >2% through Thursday. Performance of L/S funds’ long books were challenging given the larger TMT exposures, though the most crowded shorts across all regions performed well, with shorts falling 3% in North America (NA), 4.2% in Europe, and 3.8% in Asia. As a result, the spread between the top 50 crowded names in NA and Europe was positive (+1% and +1.5% respectively) while ending flat in Asia. HFs in other regions also performed well in relative terms, with the average EU-based HF down only 10 bps (vs. Euro STOXX 600 -1.7%) while Asia-based HFs and China-focused L/S equity funds fell 1% and 40 bps respectively (vs. MSCI Asia Pacific -2.9%).
Regarding flows, HFs were net sellers of global equities throughout the week, even with relatively light volumes (in-line with what can be expected in August). HFs were net sellers of all regions led by EU and Japan equities while the selling in NA and AxJ was much smaller in magnitude. In NA, HFs added to both longs and shorts, with almost all strategies tilting towards being net buyers with the exception of L/S equity funds. HFs actively shorted US ETFs, the most since September 2022, resulting in net leverage tracking ~4% lower to 42%, a low since late April 2023. Looking at sectors, HFs tilted towards selling longs in TMT-related industries (media, interactive media & services and tech hardware) while adding back to shorts in areas of the market that ranked amongst the most crowded on the short side in late May (payments, autos and specialty retail). At a factor level, HFs tilted towards selling volatility, momentum and growth. In other regions, as mentioned above, Europe ended as the most net sold region with most of the net selling being attributed to short additions. This past week ranked as the largest in terms of short additions YTD. Almost all sectors in Europe were net sold over the past four days as all saw short additions, with short adds largest within industrials, consumer discretionary, and financials. On the long side, energy and consumer discretionary experienced the largest amounts of long selling. The net selling in Europe caused EU L/S net leverage to fall ~2% WoW, but unlike NA, net leverage remains elevated given L/S equity funds had been covering shorts in outsized amounts during the three months leading up to August. There was a lot of focus on AxJ this week, but flows were relatively muted in the broader region as China was the only country to see any material amounts of net selling (split between A-shares and ADRs). By sector, the selling in China was driven by consumer discretionary, financials, and materials. Japan was sold in the largest weekly amounts in >5 months, due largely to short adds (spread across all sectors).
Quantitative strategies have also shifted their positioning. Quant exposure to value has increased lately, which could indicate further upside for value vs. growth. Nasdaq vs. Russell (NDX vs. RTY): Since the start of June, RTY has outperformed NDX by a small margin, but they’ve mostly trended together. However, the difference in exposure among CTAs appears to be falling from highs over the past month. Japan vs. China: Relative CTA positioning got quite stretched towards Japan over China by early June but has started to decline on the margin as Japan positioning has fallen from highs, while HK positioning has remained neutral. HF flows, however, remain quite negative towards local China stocks.
Private Equity
Despite a lackluster year overall for European PE investment financial services has thrived in 2023, with a focus on consolidating fragmented subsectors like asset management and insurance brokerage. According to PitchBook data, the value of European financial services PE deals for the year has reached €59.5 billion ($65 billion), benefiting from the substantial July activity of €19.4 billion. 2023 is poised to exceed both 2022 and 2021 in terms of the number of European financial services PE deals, with 267 deals this year compared to 421 in 2022 and 418 in 2021. Financial services constituted 15.2% of total European PE deal value in H1 2023, compared to a mere 6.2% in 2022. This sector’s performance is unlikely to be surpassed by any other in Europe, as per PitchBook’s Q2 2023 European PE Breakdown.
The largest deal of the year, GTCR’s leveraged buyout of Worldpay from Fidelity National Information Services, valued at around $11.7 billion, has significantly contributed to this trend. Even discounting this megadeal, the total deal value as of July 31 stands at about €48.7 billion, nearly matching 2022’s total of €49.2 billion. However, most deals have been smaller, vaued under €100 million, and focused on niche operators. Except for the Worldpay LBO, no deals have exceeded €2.5 billion in value, the next largest being Lansdowne Partners’ $1.1 billion acquisition of Crux Asset Management. The median deal value for European financial services PE deals in 2023 is approximately €39.8 million, slightly higher than the €34.6 million in 2022.
Among tight financing and reduced risk appetites, PE investors are targeting asset-light financial services businesses due to the higher barriers to invest in capital-intensive sectors like banking.
These market dynamics are also stimulating PE investment in other fragmented segments such as insurance brokerages and asset administration services, creating opportunities for consolidation and technology enhancements. Despite these trends favoring smaller transactions, uncertainty continues to be a significant factor impacting the industry. PE investment committees maintain stringent approval criteria for major deals.
Authors:
Jon Chesshire, Managing Director, Head of Research
Elisa Mailman, Managing Director, Head of Alternatives
Katie Fox, Managing Director
Sam Morris, Analyst
Data Source: Apollo, Barron’s, Bloomberg, BBC, Charles Schwab, CNBC, the Daily Shot HFR (returns have a two-day lag), Goldman Sachs, Jim Bianco Research, J.P. Morgan, Market Watch, Morningstar, Morgan Stanley. Pitchbook, Standard & Poor’s and the Wall Street Journal.