
Economic Data Watch and Market Outlook
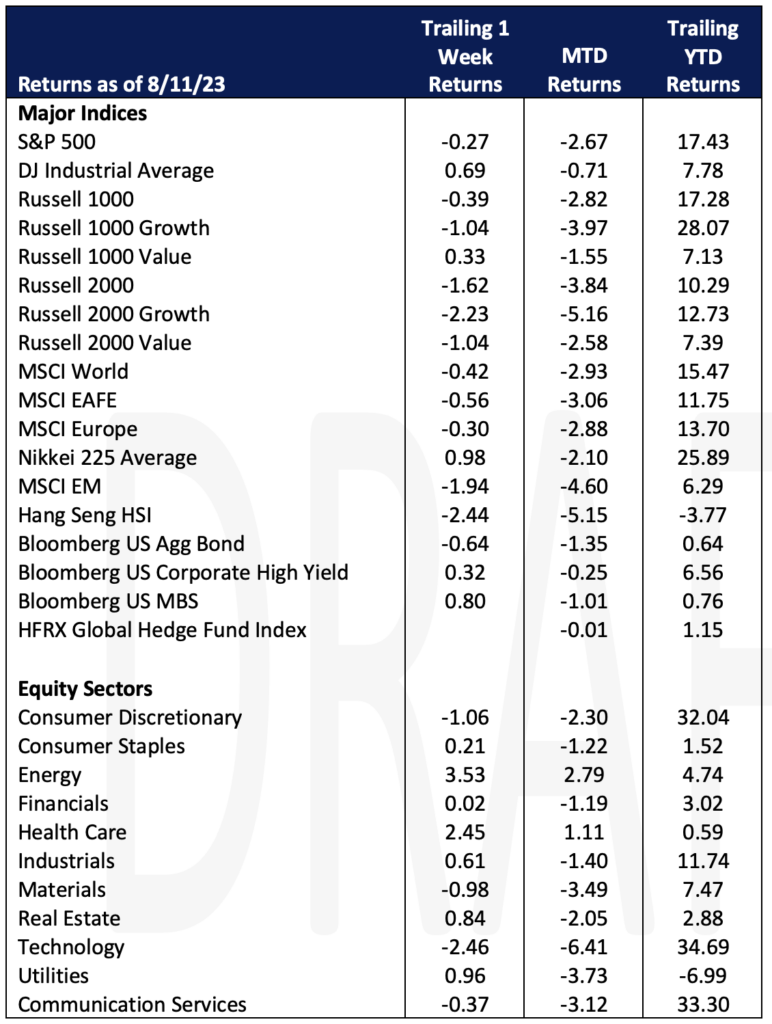
Markets were mixed for the week. Equity markets with a growth bias fell slightly (S&P 500 -0.27%, Russell 1000 Growth -1.04%), while those with a value bias rose (Russell 1000 Value +0.33% DJIA +0.69%. Internationally, most broad indices were negative. The Nikkei was the one bright spot, rising 0.98%. Bonds broadly were negative with the Bloomberg Aggregate falling 0.64%. High yield and mortgage back securities rose slightly, up 0.32% and 0.80% respectively. For context, the week has traditionally been one of the most common weeks for vacations and volume was lower for the week. SPY, the most heavily traded ETF tracking the S&P 500 saw its volume off 20% from its average and HYG, the most widely traded fixed income ETF, which tracks high yield bonds, saw its trading volume drop 30%.
Business optimism continues to improve as we saw the National Federation of Independent Business (NFIB) Small Business Optimism (NFIB) Index reported better than expectations. Jobless Claims came in better than expected (1,684K vs 1,710K) and CPI also came in cooler than expected with year-over-year results coming in at 4.7% versus the consensus 4.8%. Later in the week, however, the Producer Price Index results were reported and came in slightly higher than expected on a month-over-month basis (0.3% vs 0.2%) and year-over-year basis (0.8% vs 0.7%).
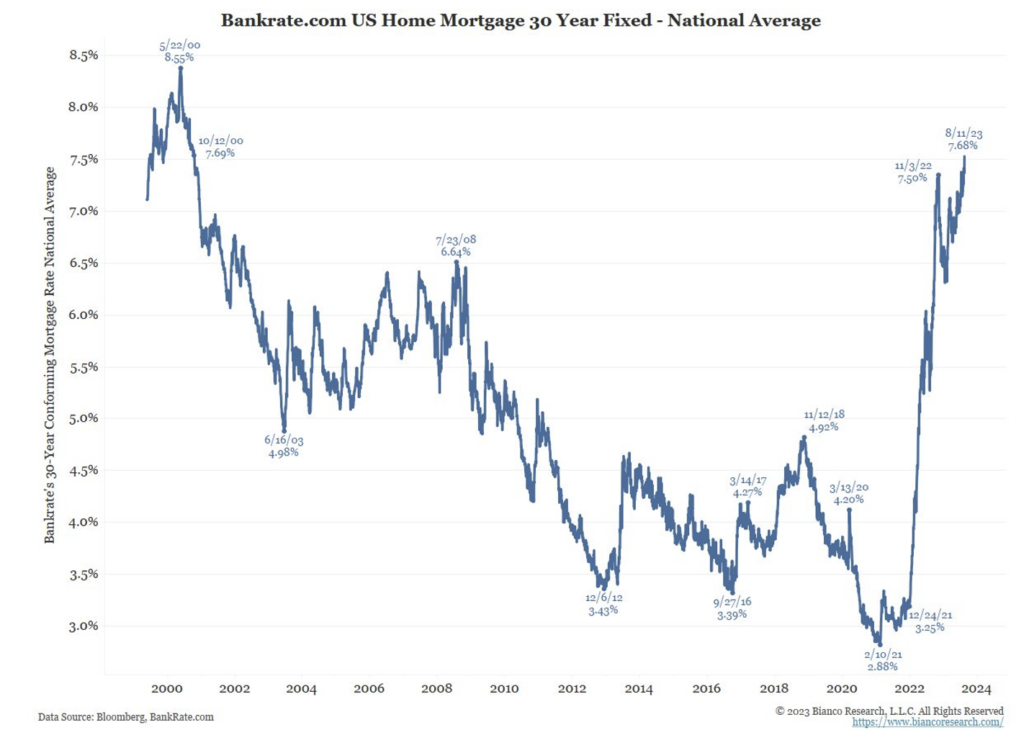
Housing continues to be constrained as the 30-year mortgage rate hit a 23 year high on Friday at 7.68%.
In a letter this week from the Federal Reserve Bank of San Francisco, it was indicated that a number of metrics on private sector rents and home prices are slowing. Data referenced includes Zillow’s Home Value Index, the Apartment Vacancy Index, and the S&P/Case-Shiller US National Home Price Index. The Fed’s model shows shelter’s contribution to 12-month CPI falling from the high single digits to potentially negative territory by mid-2024, which would be the largest contraction of the inflation metric since 2007-2009.
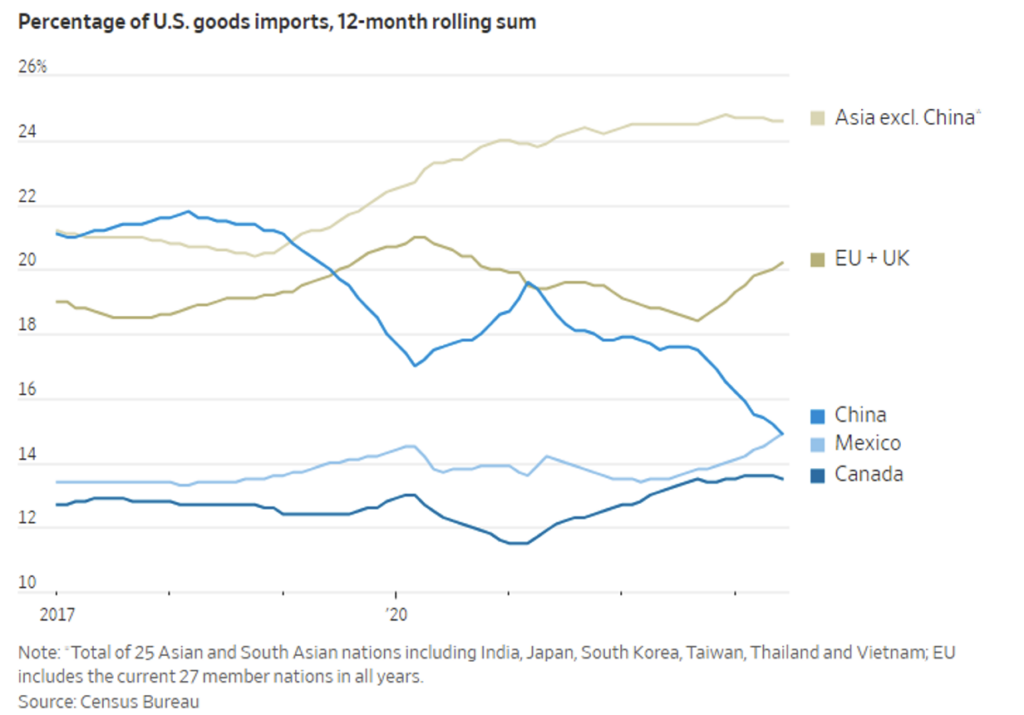
Chinese imports into the US are now accounting for their lowest percentage in 20 years as buyers turn toward Mexico, Europe and other Asian countries. China accounted for 13.3% of US goods imports during the first half of 2023, down from their peak of 21.6% in 2017, and the lowest level since 2003 when Chinese imports into the US were 12.1%.
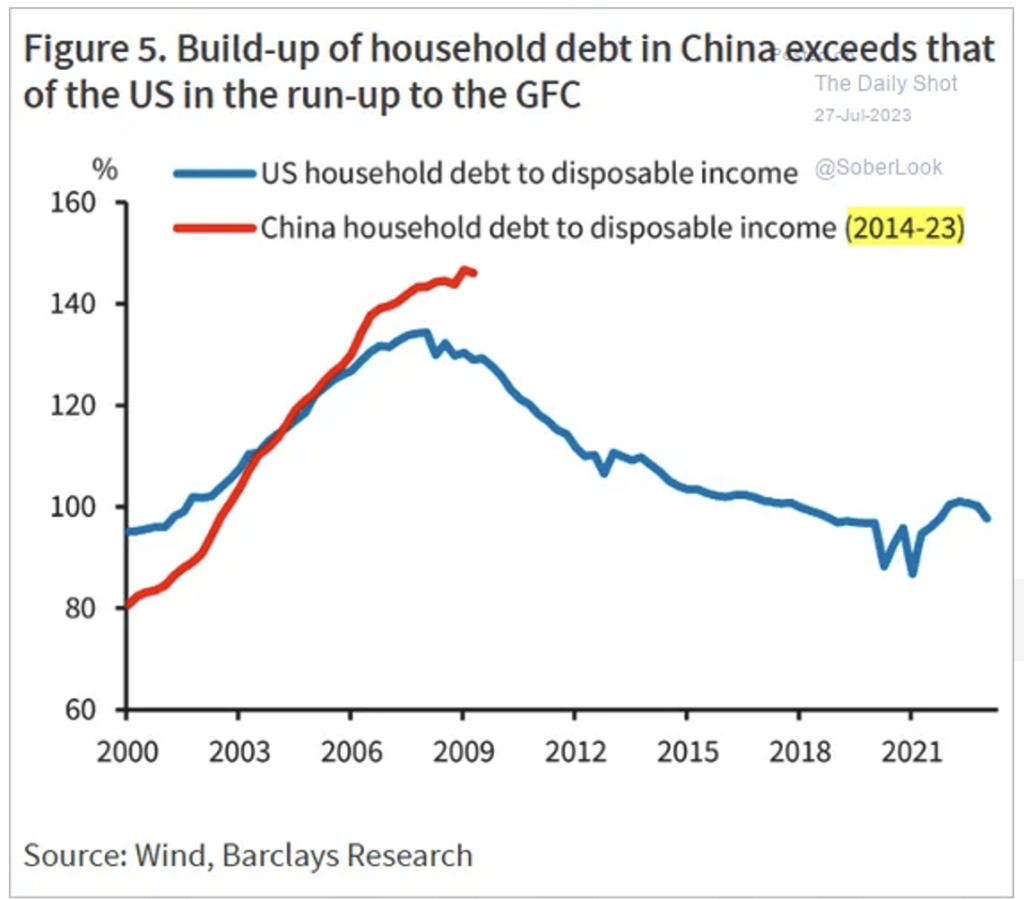
Further, a recent chart from Barclays shows household debt increasing.
The upcoming week the US will release retail and inventory data early in the week and Jobless claims will be released on Friday.
Equities
US stocks finished the week mostly lower on Friday, with the Nasdaq and S&P 500 seeing consecutive weekly losses. The Nasdaq fell -1.87% for the week, hitting a one-month low on Friday while the S&P 500 declined
fg-0.27%. Meanwhile the Dow Jones Industrial Average gained 0.69%. The fall of both the S&P 500 and the Nasdaq Composite is a sign that the stock market rally we have seen over the summer could be starting to cool. With Friday’s PPI showing supplier prices rising in July, investors are coming to terms with the fact that the economy is beginning to cool. This year big tech has been the standout, but this week Nvidia saw losses for 4 consecutive days, with the stock falling 3.6% on Friday alone. It is important to note that volume has been lower than average this week, which can be attributed to summer vacation season and the winding down of earnings season. Standouts on the positive side of the market include UBS which gapped up 5.6% in early trading Friday on news that they no longer require a $10B government backstop in their emergency takeover of Credit Suisse. News Corp was the S&P 500’s best performer for the week, rising 4.6% after reporting record profit at its Dow Jones unit.
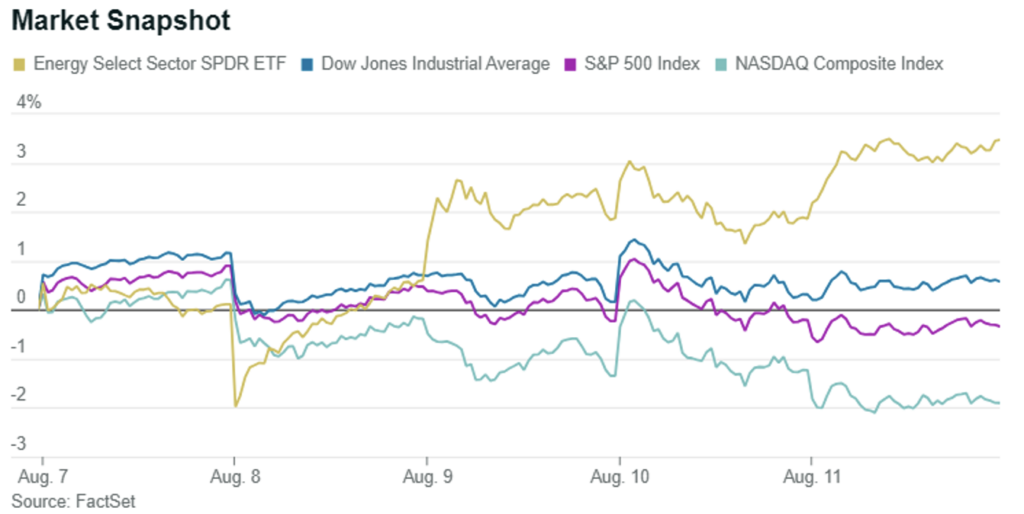
US energy stocks have seen a good start to August so far, reclaiming their place as market leaders for the first time since late 2022. The S&P 500 Energy Sector Index rose 9.7% in the first 29 days of the trading in Q3 according to Dow Jones Market Data. Rising prices of crude oil and gas have pushed shares of the largest US energy firms higher with Exxon Mobile Corp (XOM) rising 4.2% since the start of Q3. Exxon is the 12th most valuable US based company with a market cap of $450B. Meanwhile US traded crude prices have been on the rise for the last seven weeks. West Texas Intermediate crude oil futures rose 32 cents to $83.14 per barrel on Friday, while on Wednesday they closed at $84.40 per barrel on the New York Mercantile Exchange, the highest closing level so far this year. For some perspective, oil prices have fallen dramatically from their peak in 2022 when US traded crude breached $130 a barrel on March 7th which was the highest level since 2008.
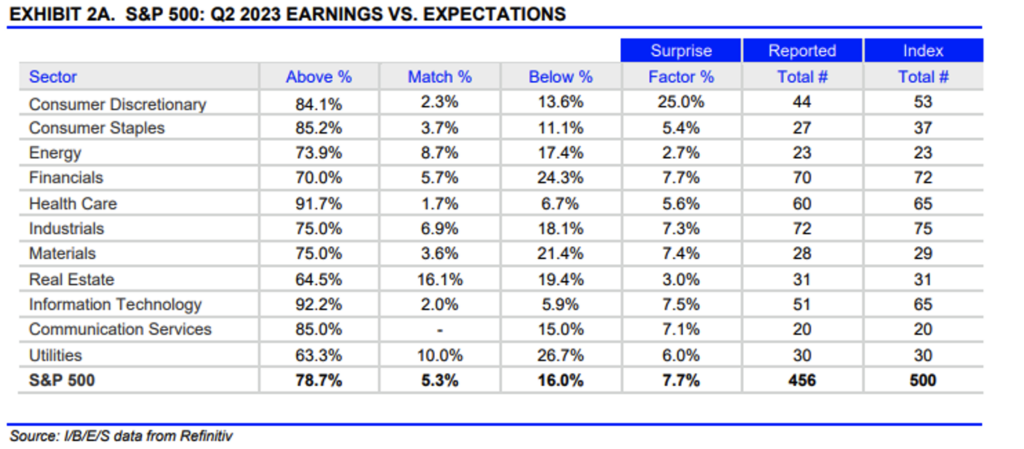
Earning season is coming to a close for the S&P 500 with 456 companies already having reported earnings. Of these companies that have so far reported, 78.7% have beat analyst estimates, well exceeding the long-term average of 66.4%. 2023 Q2 year-over-year revenue was expected to be 0.4% excluding energy with a growth estimate of 4.3%, but five of the eleven sectors have seen downward revisions in estimates. In aggregate, companies are reporting earnings that are 7.7% above estimates which is also well above the average surprise factor of 4.1%.
Fixed Income
Treasury yields rose this week in response to important economic data released Thursday which signaled a possible slowdown in inflation. The two and 10-year Treasury yields rose 11 bps while the 30-year Treasury yield rose six bps, hitting 4.19%, the highest level since 2011. The Bloomberg US Aggregate Bond index fell -0.64%, while the Bloomberg US Corporate High Yield Index rose 0.32%, and the Bloomberg US MBS Index rose 0.80%. Prior to Thursday, a number of Fed officials had stated that the Central Bank could be ready to pause their rate hike crusade, after raising rates at 11 of the last 12 meetings. Back in June, a majority of Fed officials had projected raising rates to 5.5%-5.75% by the end of 2023, but July’s CPI reading could change that.
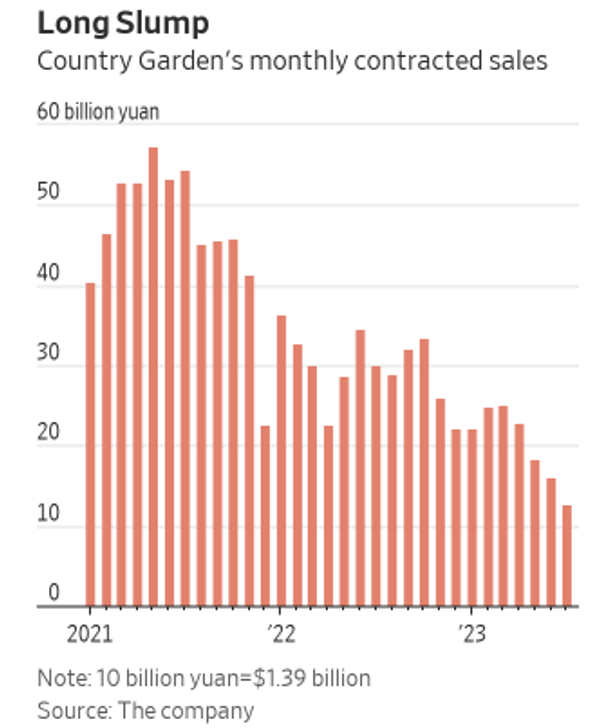
Country Garden Holdings, Chinas largest property developer is sinking further into debt crisis. The 31-year-old developer has been used as a model by Chinese authorities in the past, but recently has missed interest payments on two US dollar bonds, signaling a new stage of distress for the Chinese real estate market. Country Garden Holdings missed a $22.5M interest payment on Monday on debt securities with a face value of $1B. The prices of the two bonds have fallen to eight cents on the dollar from just above 50 cents on February. Country Garden’s monthly contract sales slipped over 30% in the first two quarters of 2023, with many of the developer’s bonds falling into distressed territory by the end of July. Later in the week, Country Garden announced that it expects to post its worst loss since going public 16 years ago. China’s housing market has further deteriorated after a short rally in early 2023. A number of large developers such as China Evergrande Group, and Sunac China Holdings have also defaulted on bonds and financial obligations over the past several years.
Hedge Funds
For the week ending Thursday, August 10th, the average global hedge fund (HF) lost 30 bps against the MSCI down 11 bps, though this week was particularly challenging for long/short (L/S) equity managers as some of the group’s top holdings in the TMT space underperformed materially. The average global L/S equity fund was down 70 bps, while US L/S funds lost 56 bps vs. the S&P down 18 bps. In other regions, EU-based L/S equity funds underperformed this week as they lost 22 bps vs. the Euro STOXX Index up 1.2%. Though on the month, they have experienced the smallest losses down only 50 bps against the index down 1.35%. In Asia, China L/S funds were down the most on average (down 2.1%), followed by Asia-based L/S funds down 1.5% vs. the MSCI Asia down 84 bps.
Following early signs of HFs adding back to the shorts last week, there was a meaningful shift in appetite to add to gross exposure this week. From a net perspective, HFs were buyers of global equities, though the bulk of the buying was driven by North America (NA) as HFs added to longs and shorts in a 60/40 split, respectively. While there was a reversal in de-grossing trends seen in other regions, there was a smaller re-engagement across European equities this week, as gross was added in small amounts. HFs added shorts across industrials/materials and consumer discretionary, while adding to longs in healthcare. Meanwhile, HFs continued to trim gross exposure in AxJ as they sold longs and added shorts to a lesser extent – HFs trimmed longs across most sectors while adding shorts in materials, tech and consumer-related sectors. Breaking out the flows in NA, most single-name sectors were bought, led by healthcare, where the bulk of the buying occurred on Aug 10th (pharma). HFs were also net buyers of consumer discretionary and TMT as they added to longs in excess of shorts. HFs began adding on the long side of leisure names which was previously among the most crowded short themes prior to the de-grossing which began in June. Within TMT, HFs continued to get longer the mega-cap/high quality TMT sector, but the buying broadened out this week to also include software names. Sentiment towards the group has improved in August despite this week being challenging in terms of performance. HFs sold US energy at the fastest pace in 2 months amid this week’s price rally. This week’s notional short selling in the sector was the largest in 5 months and ranks in the 93rd percentile versus the past five years. Offsetting the single-name buying, HFs also added to index-level hedges, which ultimately caused US L/S net leverage to rise only 1% WoW to 47%. Gross leverage was flat at 192% despite active gross additions. This can be attributed to mark-to-market impacts given both long and shorts lagged benchmarks (causing overall gross dollars invested to fall).
Private Equity
Private equity firms are facing increasing pressure to shift their financing strategies for add-on acquisitions due to concerns about the potential impact of heightened leverage on existing debt. This change in approach is driven by a combination of rising interest rates, stricter lending standards, and the constraints of existing covenants. Previously, during times of low interest rates and lenient lending standards, private equity (PE) firms could easily fund add-ons by tapping into existing credit facilities or layering additional debt onto current liabilities. However, the changing financial landscape has limited their ability to take on excessive debt.
As a result of these challenges, PE managers are finding it more difficult to secure deals, particularly add-ons, which have become a larger proportion of PE activity. In the first half of 2023, add-ons constituted 78% of total US buyouts. This marks a shift from the past, where such acquisitions were predominantly debt-funded. Instead, various financing methods are being employed, including cash reserves, additional equity issuance, and a blend of debt and equity. Private equity firms are now opting for a more balanced capital structure in add-on deals, aiming to strike a better equilibrium between debt and equity. This approach allows them to secure deals they consider valuable while remaining flexible for future adjustments.
The concern of triggering “most favored nation” (MFN) provisions is a significant factor that deters acquirers from taking on excessive debt. These clauses, common in middle-market credit facilities, enable lenders to reprice existing debt when new loans carry higher interest margins. Rising interest rates have amplified this concern, as even a slight increment in debt for an add-on could trigger an amendment and raise the interest costs of the entire debt facility. Tighter lender control and reduced willingness to lend further exacerbates the situation.
The average debt-to-EBITDA ratio for Q1 2023 stood at 4.7x, lower than the peak of 5.3x in 2021. This data highlights banks’ and investors’ growing conservatism towards lending. Additionally, private credit lenders are shying away from highly leveraged deals, further constraining available funding options.
In summary, the changing financial landscape, characterized by rising interest rates and stricter lending standards, has forced private equity firms to rethink their approach to financing add-on acquisitions. The trend is shifting from heavily leveraged deals to more balanced capital structures involving a mix of equity and debt, as PE firms strive to navigate economic uncertainties and comply with tightening credit covenants.
Authors:
Jon Chesshire, Managing Director, Head of Research
Elisa Mailman, Managing Director, Head of Alternatives
Katie Fox, Managing Director
Sam Morris, Analyst
Data Source: Apollo, Barron’s, Bloomberg, BBC, Charles Schwab, CNBC, the Daily Shot HFR (returns have a two-day lag), Goldman Sachs, Jim Bianco Research, J.P. Morgan, Market Watch, Morningstar, Morgan Stanley. Pitchbook, Standard & Poor’s and the Wall Street Journal