Economic Data Watch and Market Outlook
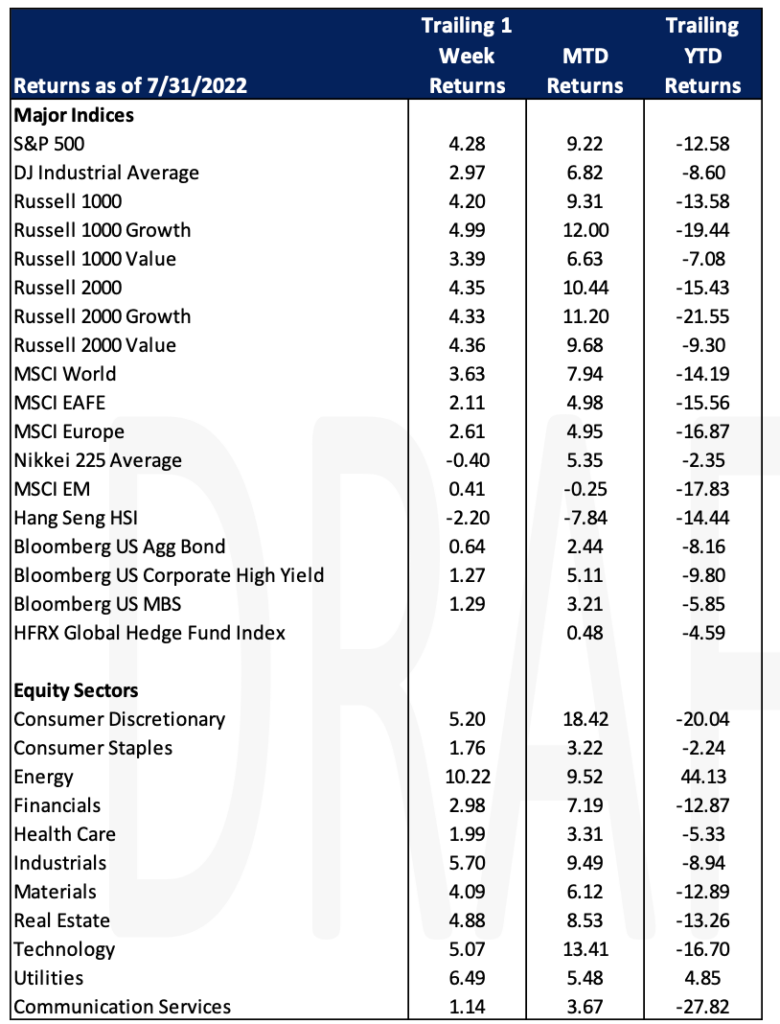
In July, US stocks as measured by the S&P 500, rose 9.22%. After the Fed raised rates by 75 bps on Wednesday, the stock market had it’s best two days since the 70’s. It broke the old record which was set after the Fed raised in March of this year. Fed Chair Powell said there will be a point where interest rate hikes will slow down to assess their impact; making rate hike decisions on a meeting-by-meeting basis. The hikes in June and July were the most stringent consecutive action since the Fed began using the overnight funds rate as the principal tool of monetary policy in the early 1990s. Powell also dismissed any speculation that the US economy is in a recession and noted the labor market was a strong signal of economic strength.
The following day, GDP data was released and slipped for the second straight quarter -0.9% after the previous release in April fell -1.6%. Two declines of economic growth have traditionally marked a recession but as we approach the mid-term elections that definition becomes a gray area as both sides are posturing for votes based on their view of the economy.
Weekly jobless claims rose slightly more than anticipated (256k vs 253k).
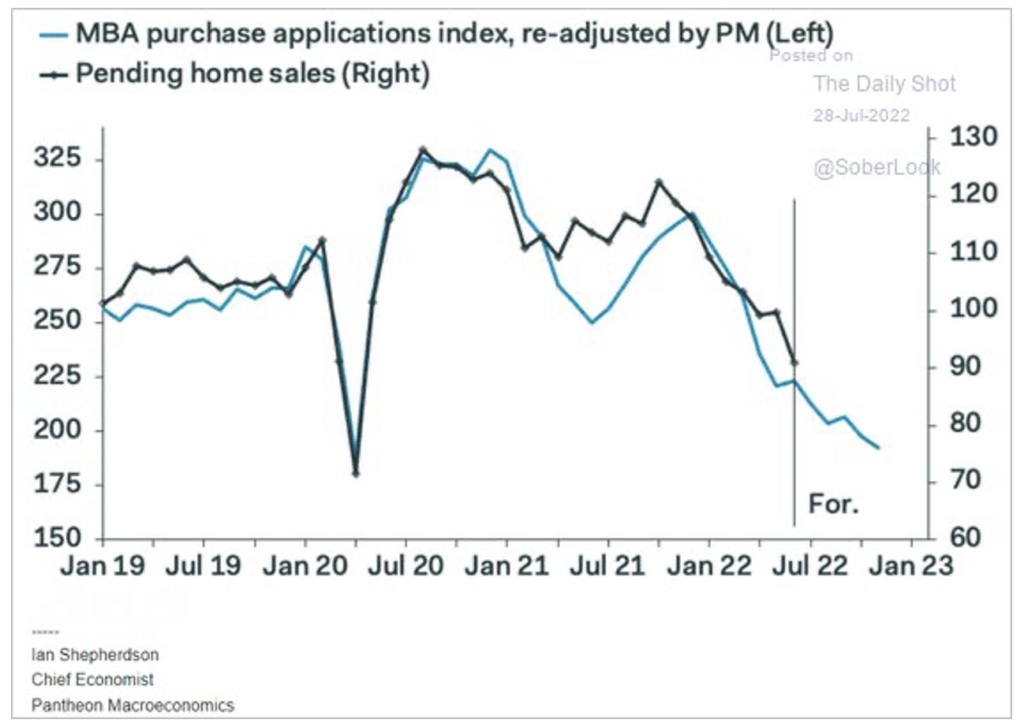
Pending home sales fell sharply for the month (-8.6% vs -1.5%). Mortgage rates dropped slightly during the week from 5.82% to 5.74%.
This week we’ll learn about the status of US manufacturing as ISM data is released on Monday. The ISM PMI is estimated to stand at 52.0. Data is compiled by the Institute of Supply Management which surveys over 400 companies. Later in the week we’ll learn more about manufacturing and import/export data.
Equities
Stocks rallied for a third consecutive day on Friday with the major US averages posting their best month since 2020. Growth stocks advanced at almost double the pace of Value Stocks based on the Russell 1000 style subsets (12.00% for the R1000 Growth vs. 6.63% for the R1000 Value).
US stocks were led by the Consumer discretionary sector which rose 18.35% for the month. Technology stocks jumped 13.41% for the month. Amazon’s stock price jumped nearly 11% after the company reported stronger-than-expected sales for the previous quarter while also giving upbeat guidance for the third quarter. Revenue growth of 7% in the second quarter topped estimates – noting progress in controlling costs such as improving the productivity of their fulfillment network while decreasing employee headcount by almost 99,000 people.
Energy Stocks jumped 10.22% for the week as inventories of gasoline plunged and exports rose.
Developed market stocks rose but nearly at the pace of their US counterparts with the MSCI Europe advancing 4.95% and the Nikkei jumping 5.35%. Emerging markets stocks sank for the week albeit slightly (-0.25%).
Fixed Income
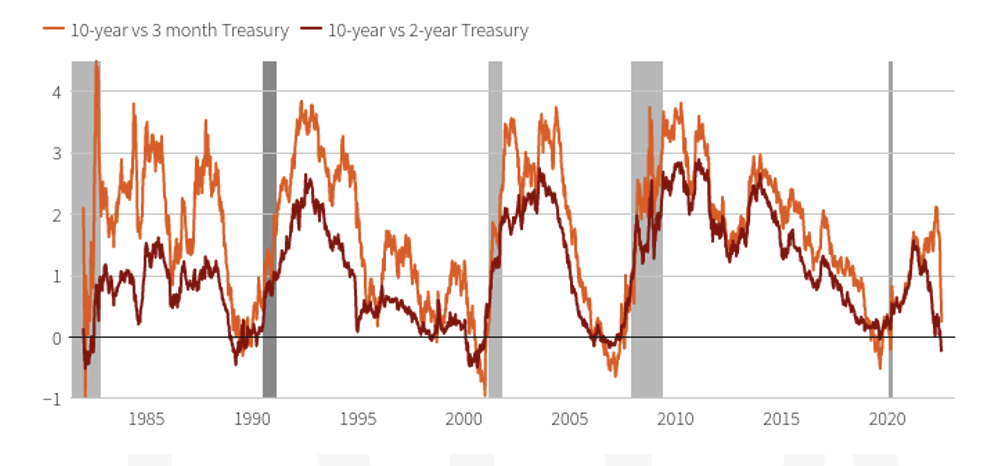
The Treasury yield remains inverted as the Fed increased the funds rate by an expected 75 basis points. As the inversion usually implies a recession to follow, Fed Chairman Jerome Powell stated that he does not view the current economy in a state of recession. The shorter duration Treasuries are seeing more volatility and are pushing higher than longer duration Treasuries. The 2-year ended the week at 2.88% vs the 10-year Treasury ending the week at 2.65%. Both saw declines in yields in the latter half of the week. The movement in the bond market this week could be a sign of the confidence that consumers have in the Fed to achieve a soft landing as it intends to do. The rates on the shorter end of the curve seem to be more effected on the downside post Fed meeting as future aggressive rate hikes by the Fed seem to have come down from expectations earlier in the year. This inversion between the 2- and 10-year Treasury has been consistent for most of the month and is the most negative it has been since 2000. The 2-year forward rate for 3-month Treasury Bills is the flattest it has been since June 2021, which many economists feel is a positive sign for the economy. The spread between the 3-month Treasury yield and what the market expects that yield to be in 18 months are a reliable predictor of a recession vs. the comparison of a longer duration bond like the 10-year to the 2-year Treasury. Futures tied to the Fed’s policy rate this week revealed the benchmark interest rate will peak in January 2023 which is earlier than the reading they gave last week. The inversion is something to monitor but it might not mean a recession is definite as a few other indicators are saying otherwise.
Hedge Funds
Not surprising, with the continued equity market rally, hedge funds posted positive returns through Thursday, but the relative performance was not as strong as the week prior. Once again, Americas-based long/short equity funds led the pack, posting gains of 1.3% but that only captured 45% of the S&P 500, compared to 80% capture the week before. Global funds were up 80 bps compared to 210 bps for the MSCI World. After outperforming all other regions through the first half of the year, European-based funds have been struggling in July, but are still ahead of the other regions YTD by a decent margin. Crowded shorts in the region weighed on returns as they were up slightly less than the Euro STOXX 600. This comes at a time when single-name short exposure is near 2-year highs. Asia-based funds were up 50 bps on the week and are down 30 bps for the month. Hedge funds continued de-grossing into the market rally during the week, but not at the same pace as the week before. Most of the activity was covering shorts with Asia seeing the largest long selling. In North America, the de-grossing was offset by mark-to-market gains so overall gross exposure basically remained unchanged for the week as did net exposure at 44%, after falling to 35% in mid-June. In NA, hedge funds were small buyers of equities, which was mostly index short covering. Utilities were net bought for the second week in a row following selling in 9 out of 10 weeks ending July 15th. Healthcare was also net bought, mostly in biotech and pharma. TMT tilted towards net selling with semis, software and media the sub-sectors most net sold and was the most net sold globally. In addition to TMT, funds were net sellers of energy (selling longs) and materials. In Asia, where most of the week’s de-grossing took place, the activity came from short covering in Japan and Taiwan and long selling in China (A-shares).
Data Source: Bloomberg, BBC, Charles Schwab, CNBC, the Daily Shot HFR (returns have a two-day lag), Jim Bianco Research, Market Watch, Morningstar, Pitchbook, Standard & Poor’s, the Wall Street Journal, Morgan Stanley, Goldman Sachs and IR+M