
Economic Data Watch and Market Outlook
Global stocks were roughly flat on the week as the quarter came to a close with the S&P500 +8 bps, the MSCI World +34 bps, and the MSCI EAFE +78bps. March’s stock advance provided some relief to the first quarter decline (-4.6%) as the S&P500 advanced 3.71% . The US Aggregate Bond Index rose for the week, up 75bps but finished the quarter, down 5.93%.
The US jobs report was released Friday with the economy adding 431,000 jobs. This was the 11th straight month of gains above 400,000 which is a result not seen since the 1930’s. Despite fears of a new COVID variant, rates have dropped sharply in the US which is likely helping add people to the labor force from earlier pandemic levels most of which are women re-entering the workforce. There is however, signs that wage growth is weakening slightly and month over month gains were 0.4%. The previous six months had seen wage growth rates of 0.5% or more.
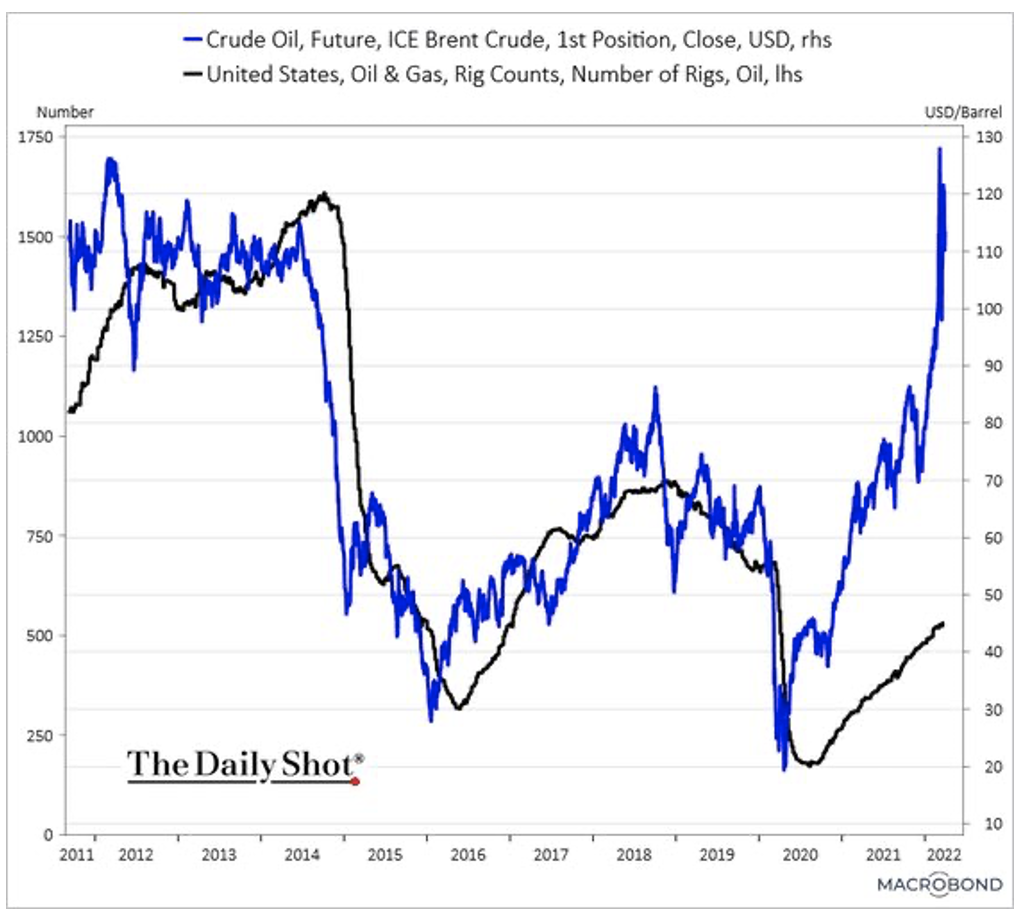
The Biden Administration announced a significant release of oil from the strategic reserves, 1mm barrels per day for the next six months. As oil prices remain elevated, evidence that the rig count (graphic below) is rising to help meet demand.
The Ukraine Russia war continues to play out on the ground in Ukraine and economically on a global basis. On the global stage, the West continues to help Ukraine militarily and tightens the screws economically on Russia. Russia has countered by mandating that those who buy their gas must pay in rubles but must also open an account through Russian banks in Euros allowing Russia to dictate the conversion fee. The Biden Administration has stepped up its commitment to provide liquified natural gas to Europe. However, infrastructure here in the US needs additional buildout. There are currently six natural gas fields in the US that are active with only one on the east coast (Baltimore) with an additional one under construction in Georgia. One is in Alaska and the remaining four in Louisiana and Texas.
As we have discussed food prices in recent weeks, there are reports that Russian warships are blocking Ukrainian ports attempting to ship grain. Additionally, missile attacks on Ukraine grain silos have also been reported. Much of the grain being exported is headed to the Middle East and Africa. This will likely create a humanitarian crisis in those areas and pressure on emerging market portfolios with exposure to frontier markets.
In past commentaries we have discussed the impact of the war on food and fertilizer supply. We are very fortunate in the US to be somewhat self-sustaining but headlines relating to fertilizer supply made news this past week as farmers are trying to determine if they should plant corn or soy. Data shows that there has been a 4% dip in acreage planting corn in favor of soy due to those rising prices.
Equities
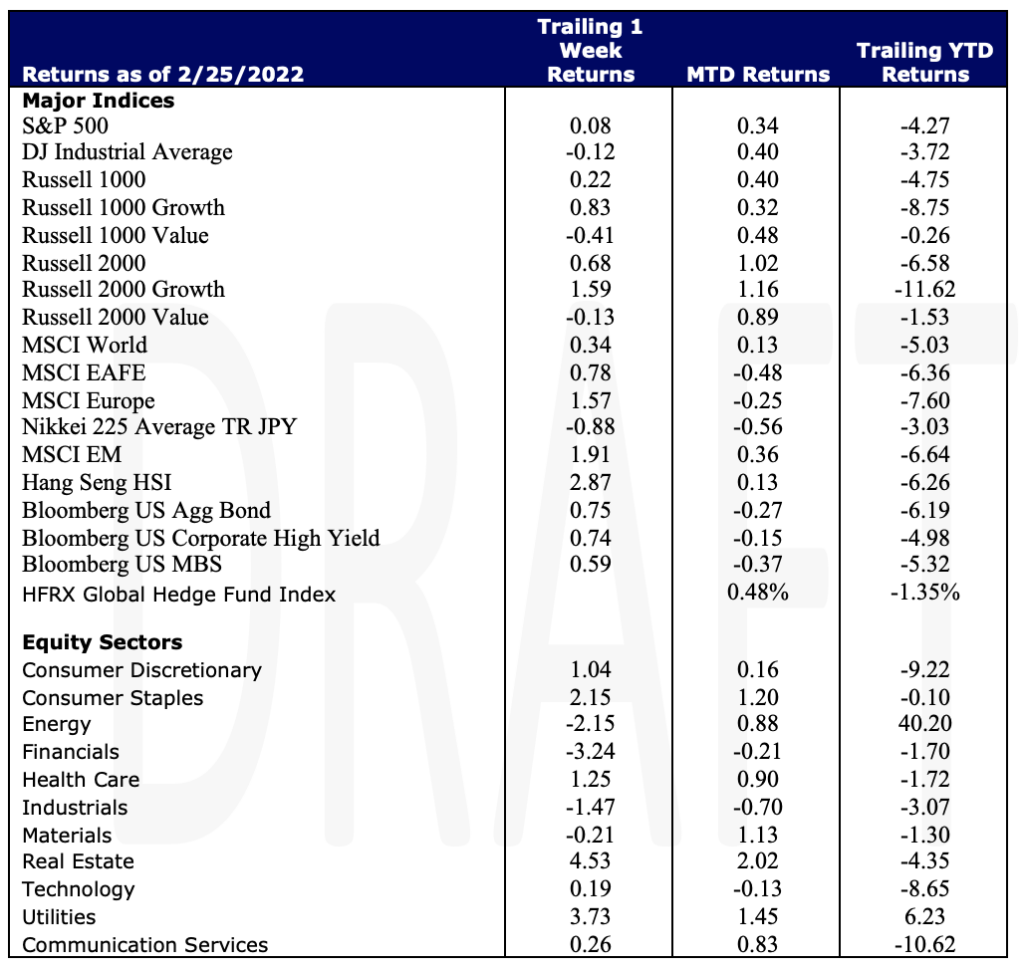
At the peak of trading on Tuesday, equities were able to fully recover from the losses experienced since the beginning of Russia’s invasion of Ukraine as talks between the two seemed optimistic. Stocks then closed sharply lower Thursday as it became apparent the two sides were having trouble reaching an agreement as well as reports were coming in that Russian Troops were being repositioned for further offensive movements. Adding to sentiment was investor fears of an impending recession of the U.S economy. The S&P added 8bps of return for the week while the Dow ended in negative territory with a weekly return of -0.12%. The equity markets are heading into an anticipated volatile second quarter; however, April is traditionally the best month of the year for stocks. One category of interest as the year continues are the returns in the large-cap and small-cap growth stocks against their value counterparts. YTD growth is still down considerably to value and large-cap growth stocks(-8.75%), albeit negative, are outperforming small-cap growth stock(-11.62%). This shift in momentum for the Russell indexes are on our radar. The month of March was a solid one for stocks as the three major stock indices, the Dow, the S&P 500, and the Nasdaq gained 2.3%, 3.6%, and 3.4%, respectively. On a quarterly basis, the U.S. stock markets logged disappointing returns. The Dow (-4.6%), the S&P (-4.9%), and Nasdaq (-9.1%) all tumbled during the quarter. Energy (-2.15%), Financials (-3.24%), and Industrials (-1.47%) performed the worst of the 11 S&P sectors while Real Estate +4.53%, Utilities +3.73%, and Consumer Staples +2.15% performed the best. YTD, Energy is storming past all other sectors with a return of +40.20% thus far.
Globally, stocks were little changed at the end of the week with the MSCI World posting a gain of 34bps while Europe continued its momentum posting a positive return of 1.57%. European stocks were down for the quarter ( -5.73% in USD terms) and a prolonged conflict could keep asset priced lower there for some time. Investors, as per ETF flows, have continued to retreat as evidenced by the graphic below.
Fixed Income
This week we saw a brief inversion of the yield curve with the 2-year Treasury Note surpassing the 10-year Treasury Note. Historically this inversion has predicted a recession typically within 2 years. A recession following an inversion is never a guarantee but historically it isn’t a bad sign for US. stocks in the near term. The 2/10-year inversion has happened 7 times since 1977 with 6 of those events not occurring during an economic shutdown due to a pandemic. A year following an inversion the S&P 500 has on average been up 11.8%, falling only once following an inversion in 2000. This inversion brings up questions if Fed Chairman Jerome Powell’s outlook going forward is altered at all following statements last week that the U.S. economy can handle a more aggressive rate hike to combat inflation. The 2s/10s spread has flattened at its fastest pace since the 1980’s. The main inversion to look for, as stated last week, is the 3-month to the 10-year not the 2-year to 10-year which will be a stronger indicator for a recession to follow. The chart below shows the historical yield inversions since the 80’s and how soon after a recession followed:
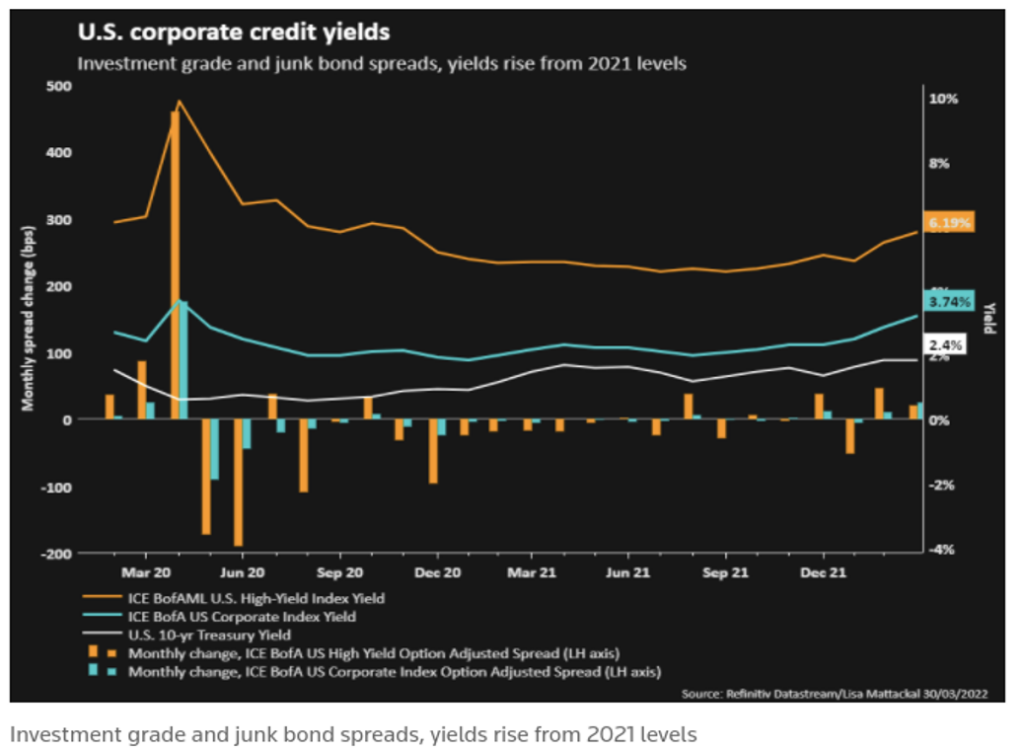
The upward curve on the above chart shows when investors are optimistic about the economy because consumers will only buy longer duration bonds that offer higher yields due to their money being locked up for longer durations. The opposite is true when the spread between the 2/10 year is tightening which indicates slower growth because investors will be more willing to buy longer bonds at lower yields amid downward market trends. The U.S. is in a strong position to deal with down trends in the market with U.S. household wealth rising to a record $150 trillion as of Q4 2021. This was a result of a strong labor market combined with pent up cash due to the pandemic which will provide a cushion and keep consumers spending during drawdowns in the market. High yield spreads are increasing relative to treasuries as stated in the chart below, which makes it an attractive purchase if the spread continues to increase. Comparatively, during the past four Fed rate hikes high yield bonds had an average return of 4.3% versus 2.0% for investment grade bonds. On a cautious note, during economic downturns the high yield market is risky and sees more signs of stress due to the higher levels of debt relative to their cash flow.
https://www.reuters.com/world/us/us-recession-unlikely-despite-bond-market-alarm-pimco-amundi-2022-03-31/
Alternatives
Hedge funds posted small gains for the week across strategies but most finished the month in the red, significantly underperforming global indices. Since Morgan Stanley started tracking hedge fund return data in 2010, 1Q22 was the 2nd most challenging quarter for Americas-based long/short equity funds only behind 1Q20. But worth noting, 2020 was the best year for long/short funds in over a decade. EU funds were the best absolute and relative performers for the week vs. other regions. Asia funds finished slightly up for the week but are still down mid-single digits YTD. Regarding flows, hedge funds continued their selling mostly by selling long positions capping off one of the largest months of selling in a decade. The selling was across all regions except Asia ex-Japan led by North America (Europe and Japan were small amounts with Japan coming from short additions while Europe had small ETF buying to offset the sells). The North American selling was dominated by healthcare, real estate, technology and consumer discretionary. Hedge funds also added to shorts, slightly reducing net leverage. The AxJ buying was more short covering than long sales leading to the lowest gross leverage in over a year. Interestingly, most of the reduction was outside of China.
This week the SEC proposed a list of changes to SPAC regulations, lessening the perceived advantage of blank-check deals. Under the proposed changes, SPACs would more closely emulate IPOs, aiming to curb the practice of unrealistic revenue projections while increasing disclosures related to sponsors’ incentives. Additionally, the proposed rules would change the definition of blank check companies which would remove the safe harbor protection around forward-looking statements and allowing investors to sue over misleading projections.
Analysts suspect the proposed rule changes will further hinder an already despondent market for SPAC mergers. In recent months, the pace of SPAC deal announcements has slowed substantially following the poor performance of many companies that recently completed reverse mergers. There are currently 654 US SPACs that have gone public but are yet to complete a merger. The proposed rules would apply to these 654 US SPACs representing $157 billion in funds raised from investors.
The commission voted 3-1 to advance the rules. Work on the final rules will begin following a 60-day public comment period.
Data Source: AGWEB Farm Journal, Bloomberg, CDC, CNBC, the Daily Shot HFR (returns have a two-day lag), Financial Times, Fund Fire, Morningstar, Pitchbook, Standard & Poor’s, US Census Bureau, the Wall Street Journal, Morgan Stanley and Goldman Sachs Capital Introduction and IR+M
This report discusses general market activity, industry, or sector trends, or other broad-based economic, market or political conditions and should not be construed as research or investment advice. It is for informational purposes only and does not constitute, and is not to be construed as, an offer or solicitation to buy or sell any securities or related financial instruments. Opinions expressed in this report reflect current opinions of Clearbrook as of the date appearing in this material only. This report is based on information obtained from sources believed to be reliable, but no independent verification has been made and Clearbrook does not guarantee its accuracy or completeness. Clearbrook does not make any representations in this material regarding the suitability of any security for a particular investor or the tax-exempt nature or taxability of payments made in respect to any security. Investors are urged to consult with their financial advisors before buying or selling any securities. The information in this report may not be current and Clearbrook has no obligation to provide any updates or changes.