Economic Data Watch and Market Outlook
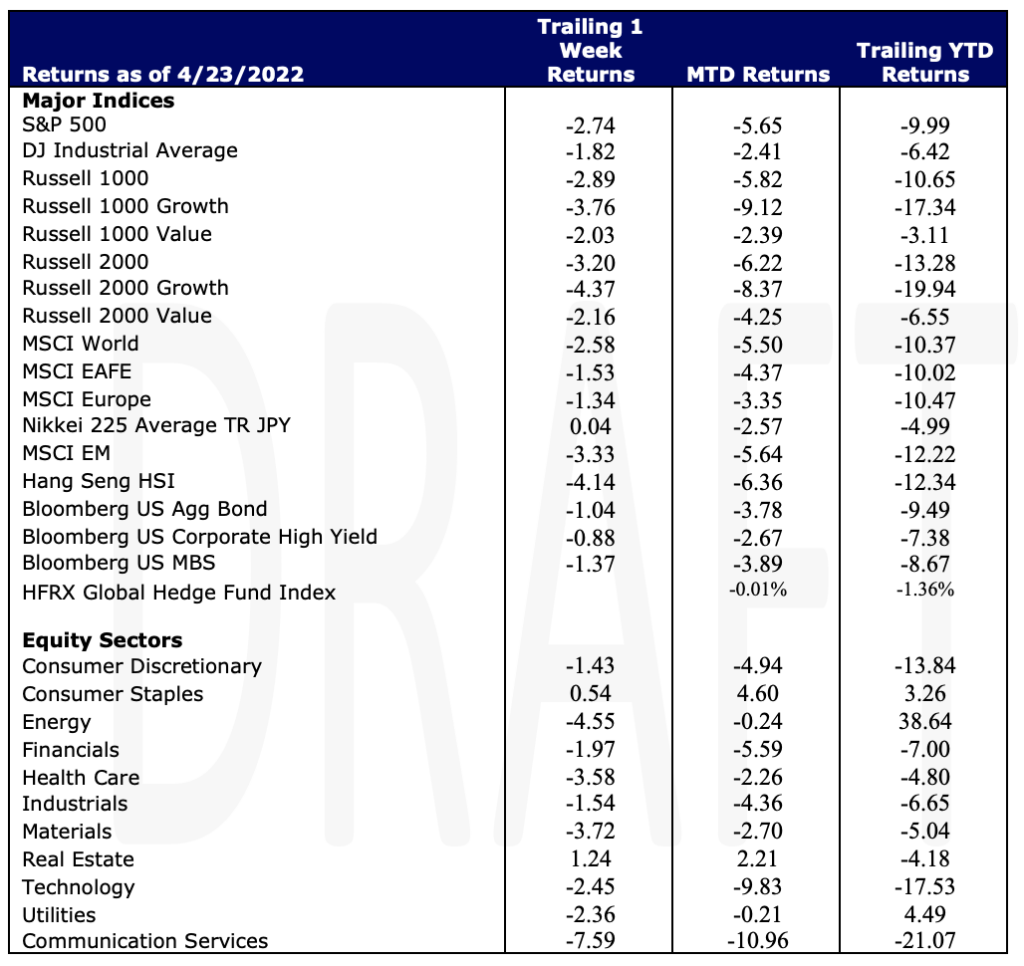
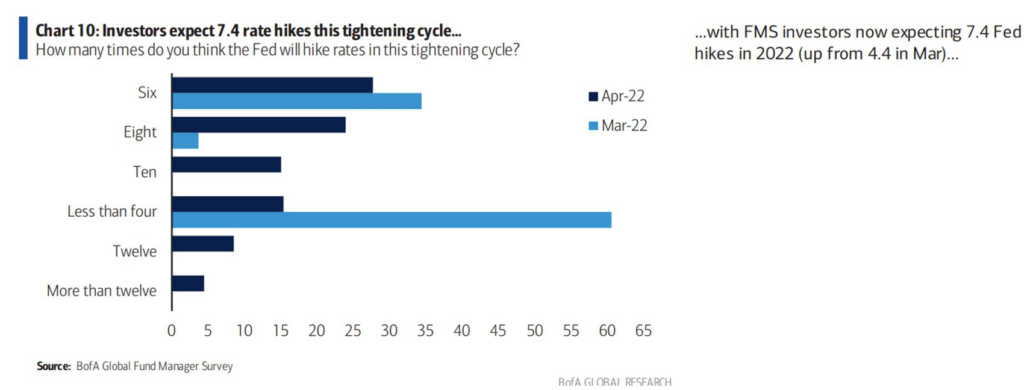
Global Equities had a tough week falling 2.58%. US stocks fell a little more losing 2.74%, with US small cap stocks falling over 3%. The US Aggregate Bond Index continued its slide, declining 1.04%, resulting in a year-to date loss of 9.49%. Fed tightening expectations continued to be top of mind. The latest Bank of America survey seems to indicate that market participants believe the Fed will have 7.4 rate hikes in this tightening cycle, up from 4.4 in March.
Last week we discussed housing noting mortgage rates hitting 5% while rents have increase 4.5%. This past week we saw building permits increase more than expected. Expect more data on the latest increases as the Housing Price Index is released Tuesday. Housing starts, home sales, and mortgage application data are released Wednesday. While we do not believe that there is a housing bubble, we have seen evidence of some cooling. For example, according to National Mortgage News, Wells Fargo has started to layoff employees in its home lending groups after a “major” decline in originations.
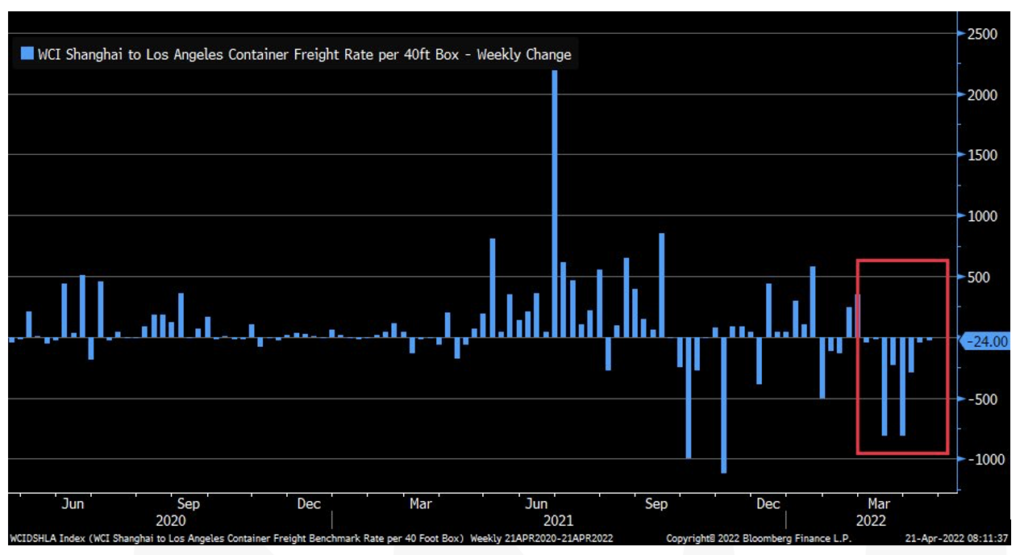
Filling those homes continues to be watched closely. Despite continued COVID related shutdowns in China, shipping costs from Shanghai to LA continue to decline from their peak in mid-2021.
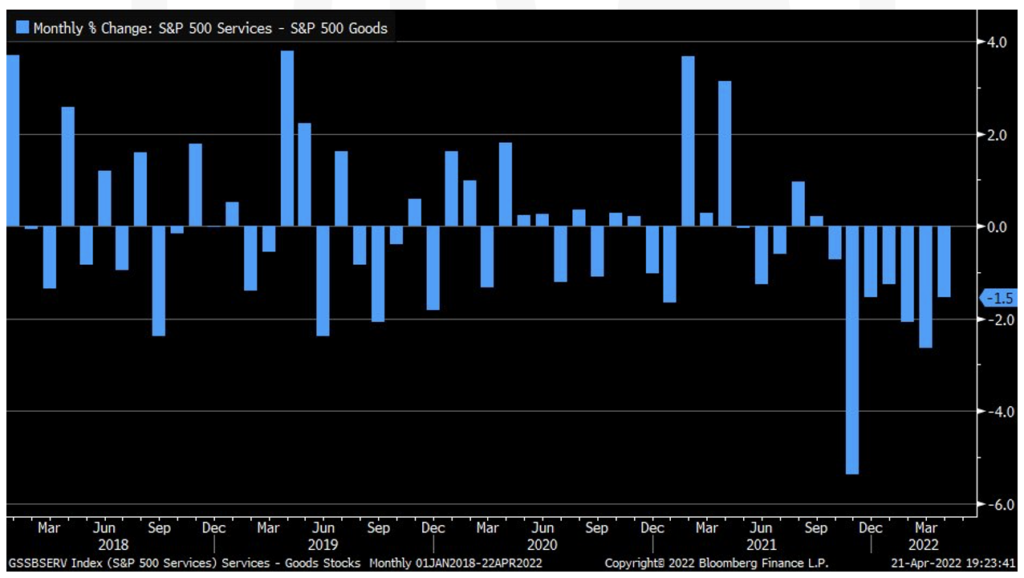
Manufacturing Purchasing Managers Index (PMI) for April overshot estimates coming in at 59.7 versus an expected 58.2. Services, however, came in less than expected at 54.7 versus the expected 58.0. These results are assembled by Markit Economics and according to them, “The data is based on surveys of over 400 executives in private sector service companies. The surveys cover transport and communication, financial intermediaries, business and personal services, computing & IT, hotels and restaurants. An index level of 50 denotes no change since the previous month, while a level above 50 signals an improvement, and below 50 indicates a deterioration. A reading that is stronger than forecast is generally supportive (bullish) for the USD, while a weaker than forecast reading is generally negative (bearish) for the USD.”
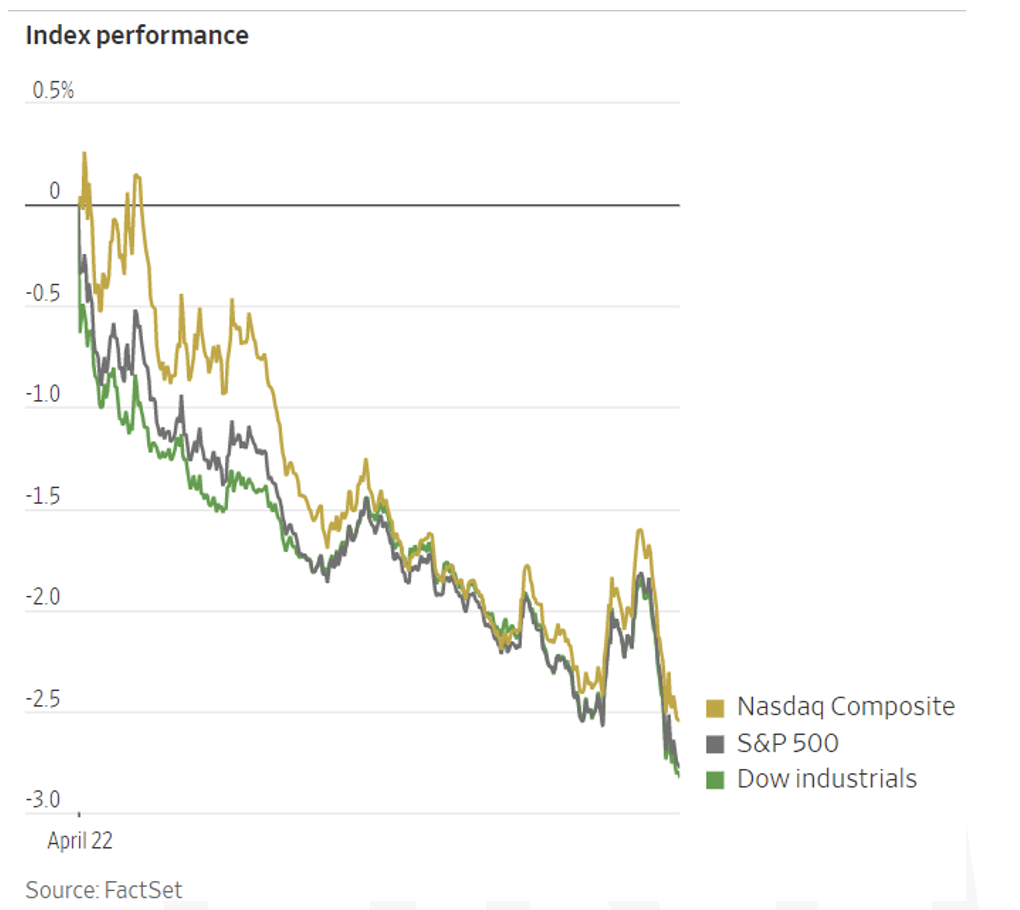
The result seems to echo the performance of goods versus service stocks. The chart below exhibits that performance as S&P services have underperformed since October.
Equities
U.S markets plummeted on Friday extending this week’s losses after comments by the Fed suggesting tighter monetary policy than originally expected as well as taking in new corporate earnings reports. It has been the third consecutive week of losses for the S&P and Nasdaq while the Dow posted its fourth consecutive weekly decline. The S&P ended the week down -2.74% while the Nasdaq returned -2.62% and the Dow posted a -2.71% loss on the week. The Dow dropped -2.82% on Friday – it’s biggest one-day fall since October 2020.
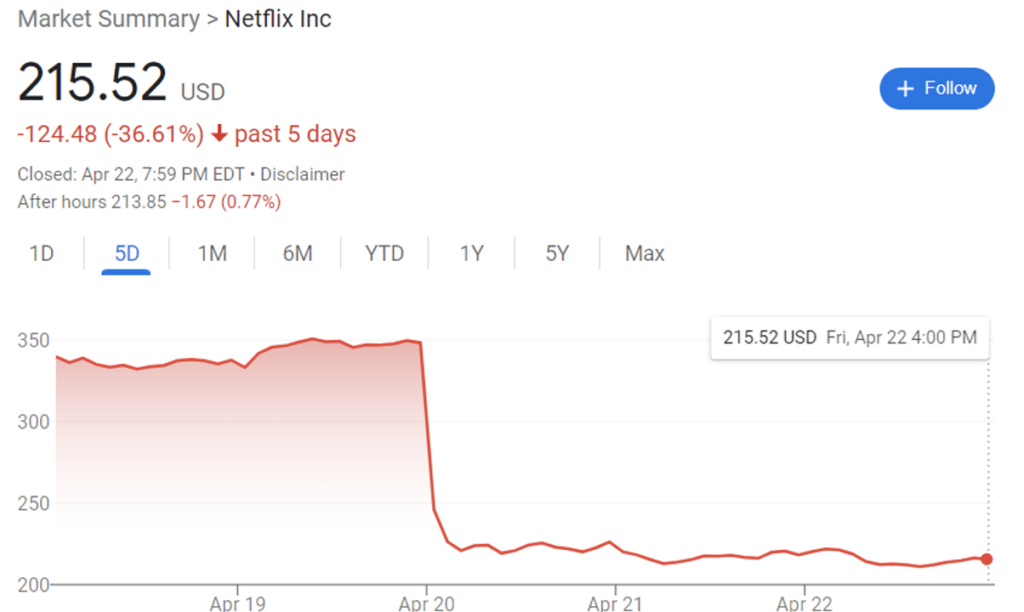
Shares of HCA Healthcare dropped 21.8% after the hospital chain lowered its guidance for the year; the company said volume and revenue for the first quarter were offset by higher-than-expected inflationary pressures on labor costs. Healthcare stocks are often considered defensive in nature, however the S&P 500’s Healthcare sector fell 3.6% on Friday – it’s worst day since June 2020. 9 of 11 S&P 500 sector ended the week with losses; Telecommunications being the biggest loser posting a weekly loss of -7.59% while Energy also lagged considerably returning -4.55% on the week. Consumer Staples 0.54% and Real Estate 1.24% were the only two sectors to contribute positively on the week. Investors also became greatly worried about Netflix this week after the company’s earnings missed targets; the stock plunged 35% on Wednesday and shed more than $50 billion in market cap. It is now the worst-performing stock of 2022 in the S&P 500, down 62.5% year-to-date.
Value stocks continue to outperform their Growth counterparts albeit both returning large negative losses on the week. Small-cap stocks in the Russell 2000 Growth led losses posting a -4.37% return on the week – it’s Value counterpart posted a return of -2.16%. Large-cap Growth stocks returned -3.76% while Large-cap Value stocks returned -2.03% on the week. Globally, stocks ended in negative territory for the week with the MSCI World returning -2.58%, contributing to its -10.37% loss year-to-date.
Fixed Income
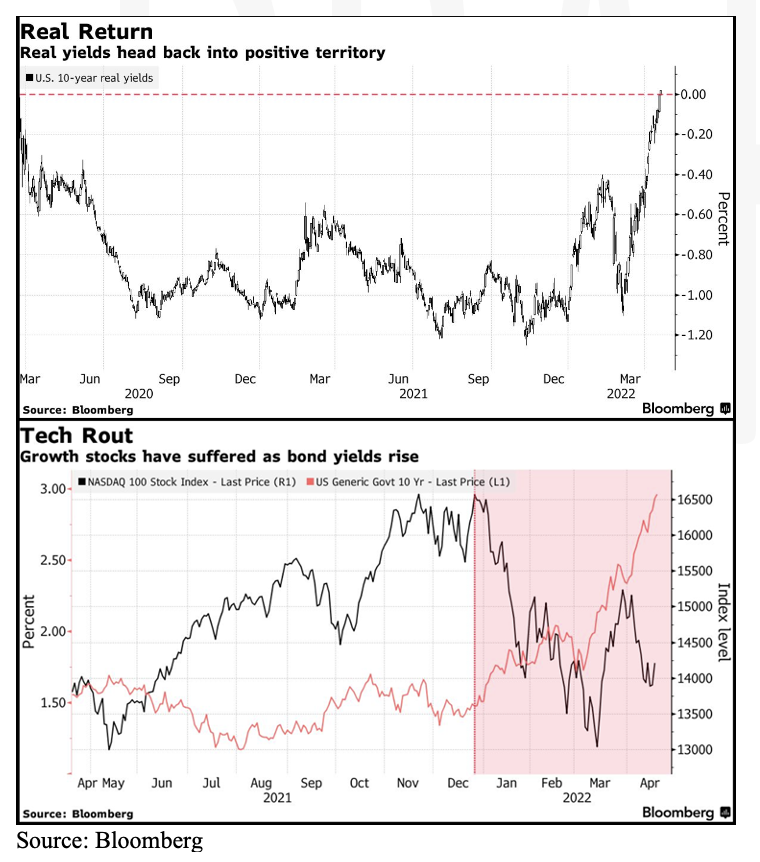
Long term Treasuries are on pace for the worst start since 1973 according to the Bloomberg Long Term Treasury Index which is down roughly 18 percent year to date. The 10-year Treasury is knocking on 3 percent’s door as of late and is up roughly 129 basis points this year alone. Fed Chairman Jerome Powell made comments this week suggesting a more aggressive approach than originally planned to combat inflation. This was a catalyst for bond yields to jump Thursday as the 10-year shot up as high as 2.97 percent which is up 50 basis points this month alone. There is an assumption that we could see 4 half percentage point rate hikes before September with the target being 2.5 percent by year end. The rising inflation combined with uncertainty and volatility in markets has seen an inflow into inflation protected securities as well as Treasuries since the start of the year. As rates have been rising you have seen an inverse reaction to growth tech stocks being that bonds are starting to look attractive and less risky than parts of the equity market. When yields started to rise beginning this year, and drastically after the March Fed meeting, there has been a big sell off in growth stocks. The NASDAQ 100 stock index specifically is down roughly 18% as of close Friday. Most tech stocks have forward valuations that they will pay out big profits down the road but higher interest rates in the long term make those earnings less valuable. Being the most growth-oriented sector, their share prices have lost significant value due to the new possibility of owning other safer investments in this rising rate market:
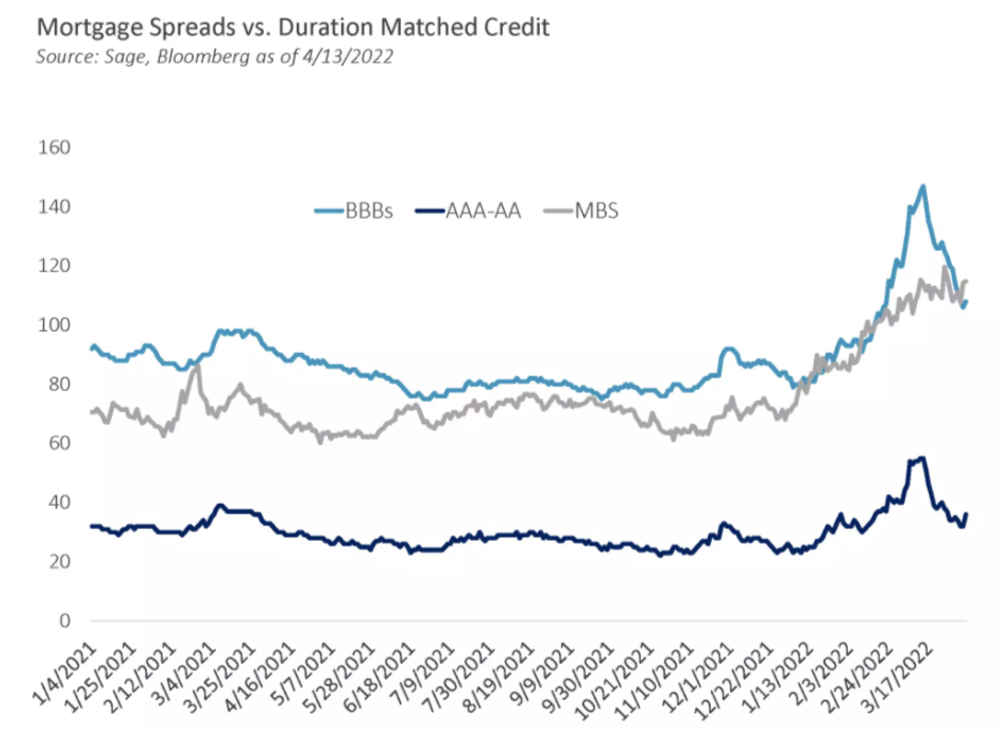
Real yields on the 10-year Treasury briefly hit into positive territory on Tuesday, first time since 2020, being as low as -1.17% during 2021. This was caused but the Fed’s Treasury bond purchase program of $80 billion a month, driving bond prices high and lowering yields. With real yields being negative for so long there has been a retreat out of the fixed income and flow towards other higher yielding spaces. Since the start of the year there have not been many areas to hide but if real yields remain positive on bonds you could see investors building out their fixed income allocations a bit more than we have seen during the Pandemic. The MBS market is also on the rise with rising rates as of late, making it as attractive as investment grade credit but safer in the near term. Below is a comparison of mortgage spreads vs equal duration credit ratings of BBB and AAA/AA. As you can see, comparatively mortgage spreads are widening more aggressively than AAA/AA and BBB ratings. Credit spreads have been tightening comparatively and mortgage spreads should only continue to widen. In the near term the MBS market does look like the safer play, but credit will be a viable option mid to late in the year.
Hedge Funds
Hedge funds held their own in the first 2 weeks of April, but reported losses in line with or below their respective benchmarks this past week. There are some bright spots in hedge fund land with macro (both discretionary and systematic) and multi-strategy managers posting positive returns YTD. Crowded names impacted returns in all regions this past week with crowded shorts down less than crowded longs. Flows were lighter for the week but tilted towards hedge funds buying global equities with activity mixed depending on the region. Gross leverage increased while net leverage fell. In North America, utilities were the most net bought sector and now sits as the most net bought sector both in notional and relative terms YTD. While utilities were the most net bought, flows to other defensive sectors are mixed YTD. Hedge funds were net sellers of FAAMG ahead of Q1 earnings next week. In other regions, hedge funds were net buyers of EU equities with the buying (short covering) coming from long/short equity, global macro and multi-strategy funds. In AxJ and Japan, flows were more muted both in aggregate and on a sector/industry level.
Private Equity
Over the past decade, the insurance subsector has accounted for the bulk of the European PE financial services deal activity, especially insurance brokers. Reaching a new record in 2021, PE deal volume for insurance brokers has increased 8.5x from just ten years ago. Over the past two years, over 70% of closed European PE insurance deals have been in the insurance broker space. Significant factors driving PE deal activity among insurance brokers include robust recurring revenue, sticky and long-term customer relationships, asset-light business models, heavily fragmented markets, and light regulation. Q1 of 2022 shows that PE Capital is still flooding into this sector and prices remain elevated.
However, Insurance PE deal activity is not without risk. High valuations and intensifying competition are making it increasingly difficult for sponsors to achieve price arbitrage and leaves little room for error during the holding period. Other risks include increased threat of further regulation and more direct-to-consumer sales by insurance companies. Despite the risks, analysts expect that as incomes and life expectancy increase, deglobalization strengthens and more black swan events hit, insurance broker PE deal activity will continue to grow and a steady pace.
Data Source: Bloomberg, Charles Schwab, CNBC, the Daily Shot HFR (returns have a two-day lag), Fund Fire, Jim Bianco Research, Morningstar, National Mortgage News, Pitchbook, Standard & Poor’s, the Wall Street Journal, Morgan Stanley, Goldman Sachs and IR+M