Investors are always assessing whether to buy, sell or stay the course. During times of market volatility such as now, investors are trying even harder to make sense of course of action. While Investment Policy Statements (IPS) can guide the investor during these periods of uncertainty by providing organizations targets and goals, it does not alleviate the anxiety of market performance. In the long term, historically speaking, the market always comes back.
While in these times of market fluctuation, it is good to stay the course as prescribed in your IPS. A wise investor needs to take deep dives into understanding what their holdings are, whether it be individual securities, mutual funds, ETFs or alternative assets. For each of these types of holding there are slightly different questions. For equities, you need to have an understanding of the industry and the company, the investment hypothesis, and the conviction of the specific name. For mutual fund or ETF’s, you need to know whether it is passive or active, as well as the market category or industry specific. For alternative assets, what investments are in your hedge fund, private equity or venture capital investment? For fixed income, what duration and quality of the instrument should you invest in given the uncertainty of interest rates?
This is a time to lean on your investment consultants / OCIO’s to determine whether actively or passively managed investments will provide better performance when the market rebounds. And if you have actively managed funds, do you have conviction in the manager and their investment process / thesis? Investment Consultants / OCIO’s can assist since they continually speak to their portfolio managers, whether it be traditional or alternative managers, to understand their investment thesis, process and outlook as well as changes to their organization. This is the “bottoms up” assessment that can help determine whether to invest in a passively managed or actively managed investment to maximize when the market rebounds.
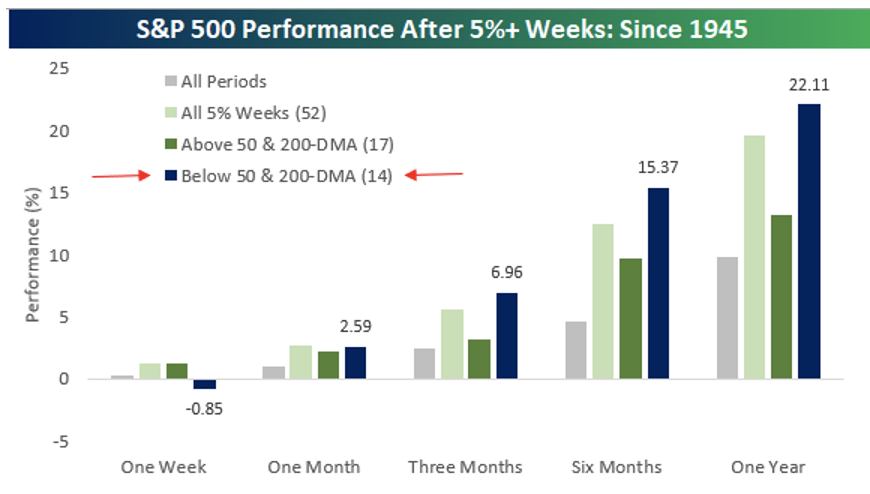
To put some perspective around what we might see in the coming weeks, months and year; last week’s rally of 6.58% was the strongest for the S&P 500 since the 7.3% surge during the 2020 election week and the 53rd rally of 5%+ for the S&P 500 since WWII (1945). In looking at the S&P 500’s chart last Friday 5-27, it was significant to see that even after such a strong rally, the index still remained nearly 7% below its 200-day moving average (DMA) and nearly 3% below its 50-DMA. Given the deep hole the equity market remains in, we were curious to see not only how the S&P 500 has typically responded following weeks when it rallied more than 5%, but also if there is any difference in performance between weeks when it rallied and was above its key moving averages versus those when it remained below those moving averages.
History has indeed proven out that those investors who are patient and work with their trusted advisors are rewarded over longer investment cycles.