

The last trading week of February 2020 ended, and we witnessed the fastest equity market price correction in history. As we know, a -10.0% decline in an equity index is considered a correction and drop of greater than -20.0% is termed a bear market. The S&P 500 over six plus trading sessions beginning on February 20th, declined by over 12.0%. This correction was quicker than the -10.0% drop seen in February 2018 which took place over a two-week time frame. Such events, which have occurred 25 times since August 1981 have always been driven by an unexpected macro/geo-political event or asset bubble. In each case, short term price movements have driven by sentiment (fear), which over-ride economics and fundamentals. This inevitably leads to an oversold condition for risk assets, and a commensurate over-bought valuation for safe haven assets. With this as a backdrop, let’s remember the famous words, “those who cannot learn from history are doomed to repeat it”.
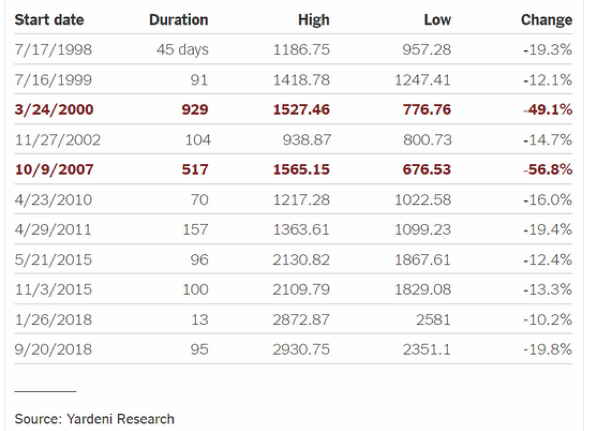
History has taught us that violent and swift price corrections in asset prices, will tend to reverse itself over time. The chart below from Yardeni research shows a sample of the 25 market corrections we have experienced since 1981, and the ensuing price change seen in the S&P 500 over several months. In short, in only two instances did the market correction turn into a bear market. The first instance was during the Tech Bubble in March 2000, and the second was the Great Recession which began October 2007.
The risk asset correction of February 2020 has been caused by the health and economic threats presented by the COVID-19 virus. To date, 83,000 individuals have contracted the disease and unfortunately 2888 deaths have occurred. China thus far has accounted for 94% of all cases, with the other 6% found in 52 other countries, according to research provided by Cowen & Company. Global markets have continued to decline due to uncertainty over the continued spread of the virus beyond China’s border, and its potential negative impact on the global economy. Epidemics, Pandemics and sickness have caused a loss in production and economic growth throughout history, but it seems global investors are now pricing risk assets at levels reflecting a certainty of a global economic recession caused by the COVID-19 virus. As we have seen historically, asset prices can be stretched both on the upside and downside, reminding us you cannot bring a rational thought or investment process to an irrational market. And once the influence of sentiment (fear) subsidies, market strategists like Clearbrook will use our investment discipline to assess the economic fallout and then determine which assets are attractive on a relative basis.
Where do we stand today? The S&P 500 finished the week at 2954.22, down 11.5% for the week and approximately 13.0% from the highs reached on Wednesday, February 19th (3386.15). This was the S&P 500’s worse weekly performance since 2008. The drop in the Index brings the forward P/E ratio to 16.7 (based on an earnings projection of $176 per share), a far cry from the close to 20 P/E, seen just eight trading days ago. But let’s reassess this valuation based on concerns espoused by David Kostin, the chief US equity strategist for Goldman Sachs. David Kostin revised his earnings model to assume a wide global spreading of COVID-19. This would cause an economic slowdown driving S&P 500 earnings growth in 2020 to 0%, down from the Street consensus of a 7.0% growth in earnings. The S&P 500’s projected earnings would thus be $165 per share, and based on a P/E of 19 (pre-correction P/E) this would bring us to a price level of 3,135, or an estimated 6.0% above Friday’s close. In addition, at a flat level of earnings of $165 per share, the earnings yield of the S&P 500 now stands at 5.6%.
If we stick with the Street EPS growth estimate of $174 per share, at a P/E of 19 we would attain an Index price level of 3,306 or approximately 12.0% above Friday’s close. Where we end up is probably somewhere in between, but we at Clearbrook believe there are a few economic, technical and monetary factors that can help foster a rebound in equity prices.
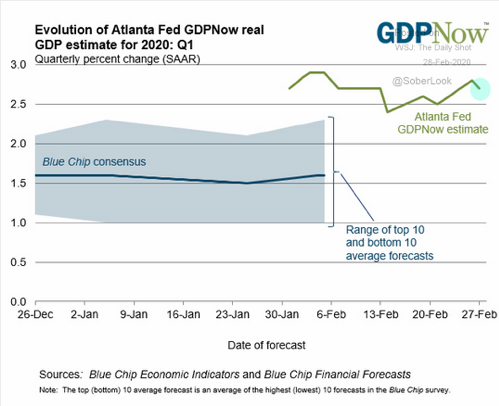
Beneath the tumult of the COVID-19 risk asset melt down, recent data releases in the US have actually surprised on the upside. New Home Sales saw its best growth rate since 2007, followed by solid reports regarding US Pending Home sales, regional US manufacturing data, personal income, and consumer confidence and sentiment. This data has the Atlanta Fed’s GDPNow model predicting 2.7% GDP growth for Q1 2020. Though we know this data series can be volatile, even if we haircut the estimate by 50%, GDP growth in the US is far from recessionary levels.
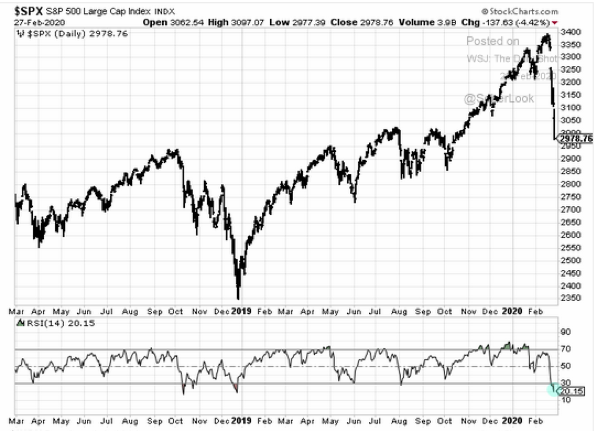
A review of market technicals confirms our instincts that equity markets are oversold and fixed income (particularly US Treasuries) is over-bought. As of Friday’s close, all three of the US major market indices (S&P 500, DJIA and NASDAQ) are oversold, and below is the chart highlighting the oversold condition of the S&P 500.
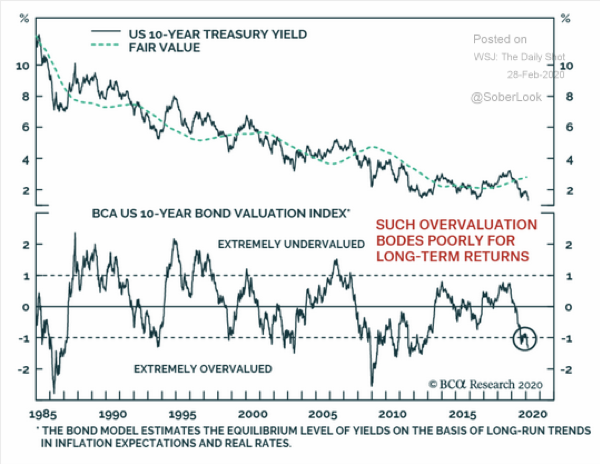
A look at fixed income has us confounded, as the 10 and 30 Year Treasuries closed at historical low yields of 1.156% and 1.679% respectively. The massive flow of capital into these safe havens have driven treasuries to an extreme over-bought level. How extreme? The 10 year and 30 year Treasuries began the year with yields at 1.920% and 2.391% respectively. As the chart below incorporates data only from Thursday’s closing prices, the over-bought level is close to 2 standard deviations as of Friday’s close. This is one of the few times in history we will see longer term treasury yields trade below the Fed Funds rate of 1.50% to 1.75%. As a reminder from above, the S&P 500 earnings yield is now 5.6% and the dividend yield as of Friday’s close is 1.97%.
Other market technicals from a historical perspective to chew on include:
-
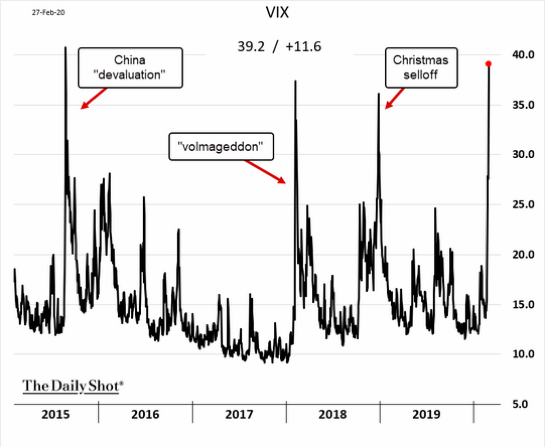
- When the S&P 500 VIX has exceeded a level of 40, a subsequent rebound in equities occurred.
-
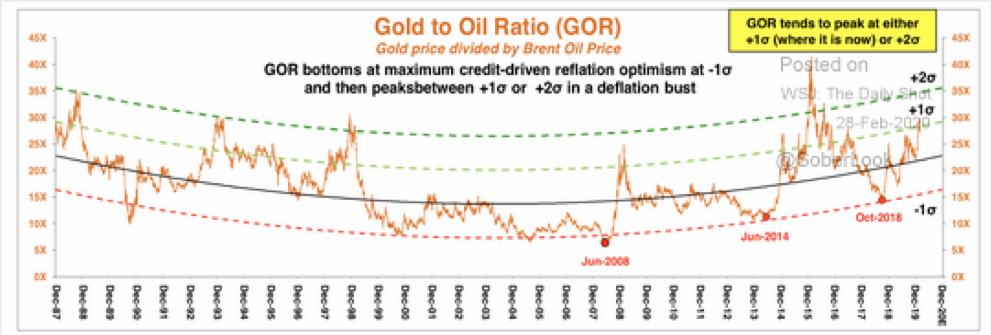
- 2) The gold-to-oil ratio is now elevated. According to Stifel, the S&P 500 in recent years has not bottomed until this ratio has peaked. The gold and oil ratio based on Friday’s closing prices of $1587.3/oz. and $45.26 per barrel respectively, is 35.07. Historically the mean is 24, and each time the ratio reached 35 or greater, equity markets tended to rally.
Clearbrook believes that the combination of extreme negative investor sentiment, leading to a steep decline in risk assets and rally in safe haven assets has presented opportunities to reposition portfolio positions to take advantage of current asset mis-pricings. In addition to the economic, technical and fundamental factors we have highlighted, there are forward looking geo-political and economic thoughts that are shaping our opinion as well.
- Corporations around the global will alter their formerly singular dependency on China to fulfill their supply chain needs. This will lead to secondary if not tertiary manufacturing and production facilities in other countries such as Mexico, US, Vietnam etc. It is also probable a number of these new facilities will employ new robotic technology among others, which will help improve productivity.
- The US markets up through mid-February had greatly outperformed non-US market indexes. Specifically, the S&P 500 had outperformed versus the MSCI World Index ex. US by approximately 8.0%. The recent drawdown of the S&P 500 has narrowed the outperformance to an estimated 4.0%. As we project the US will not experience the drag to GDP that Europe and Asia will from COVID-19, there is an opportunity to buy great companies with strong balance sheets and dominate positioning such as Apple, Microsoft, Amazon, and the like at discount valuations.
- We believe the global demand for products is pent up, inventories have been drawn down, and delayed purchases from Q1 will be moved to Q2 and H2. The all but certain decline in global GDP growth in Q1, will prompt an acceleration in global growth in Q2 and beyond. Helping us formulate this decision is also word out of China regarding the current outlook for 2020 economic growth provided by President Xi Jinping. He said despite the expected sharp decline expected for Q1 growth in China, he is confident GDP growth in China will average 5.5% for the year. With economists around the globe proclaiming their Q1 estimates for China growth coming in below 3.0% or worse for the quarter, we believe China will rev up their production engine, fiscal and monetary stimulus to meet this goal at all costs.
- The COVID-19 will negatively impact several industries going forward, with the most prominent being leisure, travel, and gaming. On the positive side, industries benefitting or being more insulated from the deleterious effect of COVID-19 would include healthcare, biotechnology, technology and information technology (children in Hong Kong and Japan with schools closed possibly through April are attending school on line), streaming and gaming, and food/product delivery services. The unfortunate economic and heath issues caused by COVID-19 for example has led to the dramatic increase in the hiring of healthcare professionals by private companies and governments.
Clearbrook’s analysis leads us to formulate the following asset allocation plan. We will shift our allocation to active US large cap and International developed market equity managers from passive options, as we believe their stock selection capabilities will be able to generate alpha by identifying quality companies with strong balance sheets that will benefit from an expected rebound in price from their heavily discounted levels. We believe there is an on-going increase in equity price dispersion across regions, countries, sectors and styles, enabling managers to capture alpha versus the passive indexes. We will also look at potential opportunities to take profits from fixed income holdings, as bonds, particularly US Treasuries have rallied to unprecedented prices and low yields. At this junction, we do not envision a change in the present allocation percentages to equity, fixed income or alternatives. A shift in our strategic allocation mix will only occur, when we have greater certainty as to the actual impact COVID-19 will have on global economic and corporate earnings growth.
Timothy C. Ng
Chief Investment Officer
This article discusses general market activity, industry or sector trends, or other broad-based economic, market or political conditions and should not be construed as customized research or investment advice. This article is for informational purposes only and does not constitute, and is not to be construed as a solicitation or recommendation of any particular investment advisory services. Opinions expressed in this article reflect current opinions of Clearbrook as of the date appearing in this material only.