
Looking Ahead This Week: November 2, 2026
Two events will dominate the week: Tuesday’s midterm elections and Friday’s October employment report. The Federal Reserve held rates at 3.75%–4.00% last Wednesday, but two governors dissented in favor of a hike, and futures markets now price roughly an 85% probability of a quarter-point increase at the December 9 meeting. That leaves the labor data with unusual weight. September payrolls rose just 29,000 and unemployment ticked up to 4.2%. Consensus expects about +55,000 jobs for October with unemployment unchanged. A materially stronger print would likely cement a December hike; another sub-30,000 reading would test the committee’s conviction that the labor market can absorb tighter policy. The data calendar builds toward Friday: ISM Manufacturing on Monday (September: 54.5, with prices paid at 77.9), JOLTS job openings on Tuesday, ADP private payrolls and ISM Services on Wednesday, and initial claims and preliminary Q3 productivity on Thursday. Six Fed officials are scheduled to speak during the week. On the midterms, investors broadly expect limited direct market impact, but a change in control of either chamber could reshape the outlook for defense spending, drug pricing, and data center regulation.
Earnings season continues at full speed, with roughly 138 S&P 500 companies scheduled to report. Apple reports Monday after the close, followed by Palantir, AMD on Tuesday, and Qualcomm and Arm later in the week, along with consumer bellwethers McDonald’s, Uber, and Airbnb. After last week’s reaction to Alphabet, Amazon, and Intel, the question is no longer whether AI demand is real but whether the cost of meeting it is eroding cash flow faster than it builds revenue. Outside the U.S., central banks remain in tightening mode: the Reserve Bank of Australia decides Tuesday, with markets pricing a high probability of a hike to 4.85%, and the Bank of England is widely expected to raise its policy rate to 4.00% on Thursday. Eurozone flash October inflation, released Wednesday, will show whether September’s 3.8% headline print has peaked. With the S&P 500 down -0.87% for October and the quarter, but the average stock up +5.00%, this week will test whether the market’s broadening can continue while its largest names are under pressure.
Economic Data and Market Highlights: Week of October 26, 2026
Macro Backdrop
The Federal Open Market Committee held the federal funds target range at 3.75%–4.00% on October 28, as markets expected, but the 10–2 vote revealed a committee more divided than its last decision. Governor Lisa Cook and Cleveland Fed President Beth Hammack dissented in favor of a quarter-point hike. The statement upgraded its description of economic activity from “solid” to “strong” and kept its assessment that inflation remains elevated, while removing language indicating that the latest policy action would support a return to 2% inflation. In his press conference, Chair Warsh described the effect of earlier tightening as monetary medicine “starting to work some,” declined to commit to a December move, and said politics played no role in the decision. On Friday, St. Louis Fed President Alberto Musalem and Richmond Fed President Tom Barkin both said higher rates could still be needed. The 10-year Treasury yield briefly crossed 5% on Fed day, peaking at 5.045% on Wednesday, before falling back to 4.93% on Friday, its lowest close since early September.
The week’s data reinforced both sides of the Fed’s dilemma. Third-quarter GDP grew at a 3.4% annualized rate, up from 2.2% in the second quarter, with business equipment spending a key driver. September PCE inflation, however, rose +0.5% for the month and 3.6% year-over-year, with core PCE at 3.1%. Real disposable income fell -0.3% and the personal saving rate declined to 3.8%, suggesting consumers are sustaining spending by drawing down savings. The Conference Board’s consumer confidence index rebounded to 91.7 from 84.2, ending three consecutive monthly declines. Energy remains the main source of headline inflation pressure: WTI crude ended the week near $104 per barrel and Brent near $118, and on Friday Iran’s Revolutionary Guards claimed several tankers caught fire in the Strait of Hormuz while using unauthorized routes, a reminder that the supply disruption is far from resolved.
Earnings delivered the week’s largest market moves. Alphabet reported third-quarter revenue of $127.6 billion, up 25% year-over-year, with Google Cloud revenue more than doubling to $30.7 billion. However, diluted earnings per share fell as other income swung to an $8.2 billion loss, and the stock fell -12.64% on Thursday, its worst day since its 2004 listing. Microsoft reported revenue growth of 19% to $92.3 billion with Azure up 48%, and its shares were little changed. Amazon reported revenue of $201.9 billion, up 12%, with AWS growth of 39%, but earnings per share of $1.89 fell short of the $1.96 consensus, and trailing twelve-month free cash flow was an outflow of roughly $42.4 billion as the company maintained its $220 billion capital spending plan. Intel fell -28.58% on Friday after issuing fourth-quarter revenue guidance of $15–16 billion, below expectations of approximately $17.1 billion, and warning that PC weakness will continue into 2027. In aggregate, Alphabet, Microsoft, Amazon, and Meta spent roughly $201.9 billion on property and equipment in the third quarter, about $26 billion more than they generated in operating cash flow. Beyond technology, the earnings season remains strong: according to FactSet, blended third-quarter S&P 500 earnings growth stands at 30.2%, with 82% of reporting companies beating estimates.
Domestic Equities
The S&P 500 declined -0.56% for the week and finished October down -0.87%. The Dow Jones Industrial Average fell -0.83%, but remains up +1.76% for the month. Performance under the surface was far stronger than the headline index: nine of eleven S&P 500 sectors gained, and the S&P 500 Equal Weighted index rose +0.82%. Communication Services was the decisive drag, falling -8.49% for the week on the Alphabet selloff and bringing its October decline to -15.11%; the sector is now -11.31% year-to-date. Information Technology fell -1.76%, finishing October down -6.80%. On the other side of the ledger, Health Care led with a gain of +3.15%, followed by Utilities (+2.04%), Materials (+2.02%), Industrials (+1.70%), and Consumer Staples (+1.63%). Energy added +1.01% and finished October up +14.00%, extending its year-to-date return to +59.92%. For the month, the S&P 500 Equal Weighted index gained +5.00% while the cap-weighted index declined -0.87%, a gap of 587 basis points and one of the widest monthly divergences since 2009.
Small caps outperformed again, with the Russell 2000 rising +1.30%, led by Russell 2000 Growth (+1.90%) over Russell 2000 Value (+0.72%); the Russell Micro Cap gained +0.87%. In large caps, the style divergence widened further. Russell 1000 Value gained +0.48% while Russell 1000 Growth fell -1.70%, and Russell 1000 Growth has now turned negative for the year at -0.17%, against +24.50% for Russell 1000 Value, a gap of nearly 25 percentage points. The October sector leaderboard tells the same story of rotation: after Energy, the strongest sectors for the month were Consumer Staples (+11.62%), Utilities (+10.17%), and Health Care (+9.87%), a decidedly defensive group, while the two sectors most tied to AI investment, Information Technology and Communication Services, were the only two to decline. The broader Russell 3000 fell -0.46% for the week and is +11.71% year-to-date.
International Equities
International developed markets outperformed the U.S. for the week, with MSCI EAFE gaining +0.87%. MSCI Germany led with a gain of +2.26%, bringing its year-to-date return back into positive territory at +1.13%. MSCI UK All Cap gained +0.51% in the week of the October 28 budget and finished October up +2.14%. MSCI Japan declined -0.35% and ended October down -4.17%, weighed by its semiconductor and technology exposure, while the Bank of Japan held its policy rate at 1.25%. The European Central Bank also left rates unchanged, holding its deposit rate at 2.50%, as eurozone inflation of 3.8% collides with slowing growth. The more significant European news was Christine Lagarde’s announcement that she will step down as ECB President on February 7, 2027, roughly nine months before the end of her term, adding a leadership transition to an already difficult policy environment. Global indices were held back by U.S. mega-cap weakness, with MSCI World declining -0.23% and MSCI ACWI -0.29%.
Emerging markets fell -0.71% (MSCI EM), finishing October down -8.04%, the weakest monthly result of any major regional equity index we track. MSCI China declined -0.44%, bringing its year-to-date loss to -17.91% and its trailing one-year loss to -20.93%. Mainland Chinese shares extended their losing streak to twelve consecutive weeks, the longest since the CSI 300 launched in 2005, as reported state-backed buying failed to offset weak domestic demand, ongoing property sector stress, and the spillover from the global AI selloff. Hong Kong-listed shares fared somewhat better late in the week. MSCI India Domestic rebounded +2.20% but remains -13.91% year-to-date as high energy import costs continue to weigh on the economy.
Fixed Income
Fixed income posted a fourth consecutive positive week. The Bloomberg US Aggregate Bond Index gained +0.56%, and Bloomberg US Treasuries returned +0.52%, despite the 10-year yield briefly topping 5% around the FOMC decision. For October, the Aggregate gained +2.44% and Treasuries +2.36%, reducing the Aggregate’s year-to-date loss to -0.54%. Bloomberg US Corporate Bonds gained +0.48% for the week and +2.16% for the month, as credit markets remained orderly through a turbulent earnings stretch, while the Bloomberg US Agency index added +0.40% and has turned positive for the year at +0.28%. The Bloomberg Global Aggregate Float Adjusted index gained +0.31% and has improved to -1.26% year-to-date.
October’s bond rally came against a backdrop that would not ordinarily favor duration: 3.6% headline inflation, 3.4% GDP growth, and a Fed that remains biased toward tightening. That combination underscores how much of the recent rally reflects a softer labor market and flight-to-quality demand during the technology selloff, and it also highlights the market’s vulnerability to this week’s data. A strong October payroll report could quickly push yields back toward 5%, while another weak reading would likely support the recovery. With starting yields near multi-decade highs, high-quality fixed income continues to provide meaningful income and has once again demonstrated its diversification value: in a month when the S&P 500 declined and emerging markets fell more than -8%, the Aggregate delivered a gain of +2.44%.
Alternatives & Commodities
Gold fell -2.71% for the week, finishing October down -6.87% and extending its year-to-date loss to -10.19%. The metal continues to trade primarily as a rate-sensitive asset rather than a hedge against geopolitical or equity market risk. A Fed that has signaled it is not finished tightening, two hawkish dissents, and rising expectations for a December hike all kept real yields elevated, overwhelming the support gold might otherwise draw from renewed tension in the Strait of Hormuz and a volatile month for technology stocks.
Energy gained +1.01% for the week and +14.00% for October, bringing its year-to-date return to +59.92%, by far the strongest of any S&P 500 sector. With Brent crude holding well above $110 per barrel and fresh incidents reported in the Strait of Hormuz, the sector continues to serve as one of the most effective hedges against the inflationary effects of the supply disruption; Exxon Mobil and Chevron both reached record highs following their quarterly results. Real estate investment trusts (FTSE NAREIT Composite) gained +1.09% for the week and +4.40% for October, bringing their year-to-date return to +11.74%. Like fixed income, REITs have benefited from the October decline in Treasury yields and will remain sensitive to the direction of rates following Friday’s employment report.
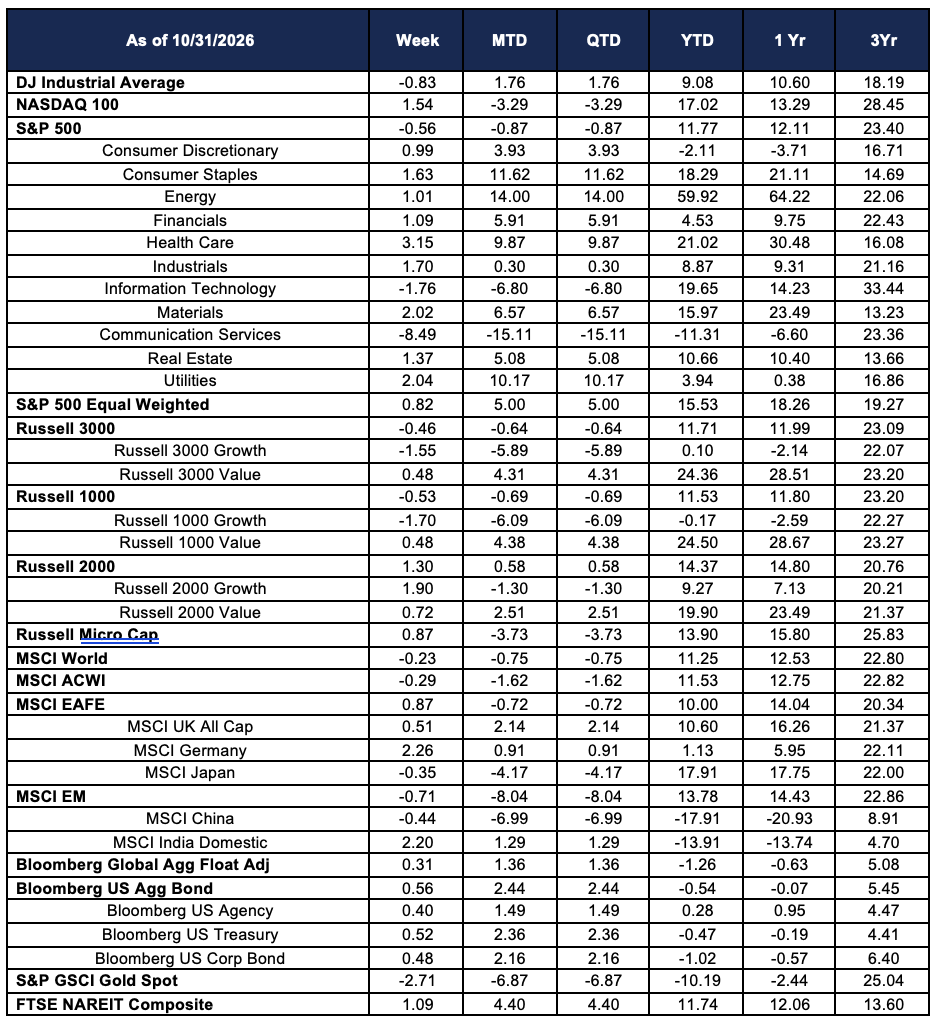
Source: Morningstar. Market data as of October 30, 2026. Past performance is not indicative of future results. The information provided is for educational and informational purposes only and does not constitute investment advice.