
Looking Ahead This Week: October 19, 2026
The week ahead brings the most consequential cluster of technology earnings reports since the AI cycle began in earnest: Meta Platforms reports after the close on Wednesday October 21, followed by Tesla the same evening, and a broader slate of large-cap technology companies through the week. The stakes are elevated well beyond ordinary earnings scrutiny. The semiconductor sector has lost approximately $2 trillion in market value over the past two weeks, with 22 of the 30 stocks in the Philadelphia Semiconductor Index now more than 20% below the record highs set in May or June — a correction-level decline that has been driven in part by questions about the pace and payback of AI infrastructure spending. Meta’s capital expenditure guidance will be parsed with unusual precision: it was a weaker-than-expected OpenAI revenue figure and cautious commentary from Broadcom’s CEO that triggered much of the sector-wide selling, and a strong AI monetization signal from Meta — whose Muse personal AI assistant reached the top of the App Store just three weeks ago — could either stabilize the narrative or confirm the concern. Tesla’s report will be watched for both its energy storage business and any commentary on consumer demand in an environment where high financing costs have been a persistent headwind for big-ticket purchases.
The Federal Reserve’s October 27-28 meeting arrives at the end of the month having been complicated considerably by the week’s September CPI print. With headline inflation at 3.7% year-over-year — above the 3.6% consensus — and the Strait of Hormuz physically constrained for a ninth consecutive month, the committee now faces a sharper version of the same dilemma it navigated in September: a labor market that has weakened significantly, with two consecutive sub-30,000 payroll months, alongside headline inflation that is re-accelerating rather than retreating. The futures market has moved to price a higher probability of an October hike following the CPI release — though a hold followed by a December move remains the modal expectation — and the combination of earnings results, any additional labor market data, and the market’s response to the semiconductor selloff will collectively inform whether the committee has the confidence to act before year-end or chooses to wait for more clarity. The Fed’s October decision may be the most genuinely uncertain of the current tightening cycle.
Economic Data and Market Highlights: Week of October 12, 2026
Macro Backdrop
The week of October 12 was defined by two events whose interaction produced one of 2026’s most dislocating market weeks: September CPI arriving hotter than expected, and the Philadelphia Semiconductor Index entering a correction that erased approximately $2 trillion in market value from the sector that had carried the equity market’s bull case for the better part of the year. The September CPI print, released Tuesday October 14, showed headline inflation at 3.7% year-over-year — above the 3.6% consensus and meaningfully above August’s 3.4% — driven predominantly by energy costs that reflect the now-nine-month-old Strait of Hormuz supply disruption. The print was the highest headline CPI reading since the spring, and it arrived at precisely the moment the market had been hoping for a data point that would allow the Fed to hold at its October 27-28 meeting. Instead, the number reignited December hike expectations and raised the October probability meaningfully — leaving rate-sensitive assets in an uncomfortable position heading into the final two weeks before the FOMC decision. Bond yields initially surged on the print, though the flight-to-safety bid from the subsequent equity selloff partially reversed the move by week’s end.
The semiconductor selloff that had begun quietly in the prior week accelerated into a broad capitulation event. Broadcom’s CEO had issued cautious commentary on AI chip demand timing, and a weaker-than-expected OpenAI revenue figure had introduced the question that the market had been reluctant to ask directly: whether the extraordinary pace of AI infrastructure capital expenditure was beginning to outrun demonstrable near-term monetization. The PHLX Semiconductor Index shed more than $1.6 trillion over six sessions through Thursday alone, and the iShares Semiconductor ETF (SOXX) recorded its fifth consecutive day of losses — its longest losing streak since May 2025. The framing that emerged in market commentary was a distinction between two possible interpretations: a valuation reset in a sector that had gained 70%+ year-to-date and needed to consolidate against fundamental uncertainty, versus a structural inflection in AI capex demand that would be validated or refuted by the earnings reports due the following week. The Q3 earnings season opened on a constructive note — Financials gained +1.42% for the week as major bank results came in broadly in line with elevated expectations — but the technology sector’s -6.37% weekly loss overwhelmed the bank-driven positive sentiment.
Domestic Equities
The S&P 500 fell -1.93% for the week, but the headline understates the degree of bifurcation within the index. The Dow Jones Industrial Average gained +0.67%, creating a 260-basis-point weekly spread between the two indices that stands among the widest Dow-NASDAQ divergences of 2026 — a mirror image of the weeks in late September when the two moved in opposite directions for entirely different reasons. Information Technology fell -6.37% and the NASDAQ 100 declined -5.49%, pushing the index’s year-to-date return from +22.91% to +16.16% in a single week — an extraordinary compression of the technology premium that had been the defining characteristic of 2026’s equity bull market. The equal-weighted S&P 500 index gained +0.50% against the cap-weighted index’s -1.93% loss — a 243-basis-point spread that captures precisely the degree to which mega-cap technology concentration drove the index-level decline while the average stock actually advanced. Consumer Staples surged +5.05%, Energy advanced +5.02%, Health Care gained +3.43%, and Materials added +2.47% — all posting their best weekly performance of Q4. The growth-versus-value divergence reached a level rarely observed outside of major market regime changes: Russell 1000 Growth fell -5.04% while Russell 1000 Value gained +0.88%, a nearly 593-basis-point weekly spread.
Small-cap growth bore the most severe losses of the week. The Russell 2000 fell -3.04% and the Russell Micro Cap declined -5.19%, but the composition was stark: Russell 2000 Growth declined -5.03% while Russell 2000 Value fell only -1.02%. The small-cap growth cohort sits at a year-to-date return of just +5.19%, having surrendered the majority of the AI-driven technology gains that briefly elevated it earlier in the year — a figure that stands in dramatic contrast to Russell 1000 Value’s +23.08% year-to-date return and illustrates the degree to which 2026’s most durable equity winners have been large-cap, dividend-paying, value-oriented businesses rather than the high-multiple growth names that dominate the growth indices. Financials gained +1.42% for the week as Q3 bank earnings provided a constructive opening to the reporting season. The hot CPI print, while creating near-term rate uncertainty, also validated the net interest income thesis for banks that had been the sector’s fundamental case throughout the post-hike period — a dynamic that kept the Financials sector positive even as the policy uncertainty around the October FOMC meeting increased.
International Equities
International developed markets delivered a striking outperformance over U.S. equities in a week when the global technology selloff dominated the domestic tape. MSCI EAFE gained +1.44% — a 337-basis-point outperformance over the S&P 500 — as the European indices, with their materially lower technology and semiconductor weightings, were largely insulated from the sector-specific carnage that drove U.S. weakness. MSCI UK All Cap surged +4.16% — its best weekly performance of 2026 — driven by the FTSE 100’s heavier composition of energy companies, which benefited from the Brent crude advance following the hot CPI and continued Hormuz constraints, as well as financials. The UK’s year-to-date return improved to +11.65%, closing the gap with U.S. large-cap indices that had been driven by AI-linked technology companies. MSCI Germany gained +2.50% and its year-to-date return recovered to +0.84% — back into positive territory after the prior week’s deterioration — as European industrial names benefited from the value rotation and a modest euro recovery. MSCI Japan declined -1.42%, dragged lower in part by its own semiconductor exposure and some yen dynamics as global capital flows responded to the U.S. technology selloff.
Emerging markets posted the week’s most severe decline at -4.56% (MSCI EM) — a loss that, in an ordinary week, would have been the headline story but was overshadowed by the dramatic developments in U.S. technology. The EM decline was concentrated outside of India, which delivered a sharp +4.13% recovery — one of the strongest single-week performances among major markets globally. India’s rebound likely reflected a combination of the Reserve Bank of India’s measured policy response to domestic inflation pressures and a rotation of investor interest toward value-oriented emerging markets as the AI-tech premium in growth indices was unwound. MSCI China gained a modest +0.14% but its year-to-date loss stands at -13.68%, and the structural headwinds of Hormuz energy costs, geopolitical risk premium, and domestic property sector overhang remain fully intact. The EM selloff outside of India and China was broad-based, reflecting the impact of the rising rate-hike probability on emerging market currency and capital flow dynamics: the combination of hot U.S. CPI and a Fed that may hike again in October or December tightens the financial conditions that have been the primary constraint on EM performance throughout 2026.
Fixed Income
Fixed income markets delivered a positive week despite the hot CPI print, with the Bloomberg US Aggregate Bond Index gaining +0.88% — a result that appears paradoxical against the backdrop of inflation running at 3.7% year-over-year. The resolution of the paradox lies in the flight-to-safety dynamics that accompanied the semiconductor sector’s collapse: while the CPI data initially drove yields higher on Tuesday morning, the equity market’s subsequent deterioration — particularly the $2 trillion erosion in semiconductor market capitalization — generated a risk-off bid for Treasuries that more than offset the inflation-driven selling. Bloomberg US Treasuries gained +0.91% and the year-to-date return improved to -1.54%, a significant recovery from the -2.74% trough of the prior week. Bloomberg US Corporate Bonds gained +0.86%, reflecting both the safety bid and the positive signal from bank earnings: strong Q3 results from JPMorgan, Wells Fargo, and their peers suggested that corporate credit quality remains resilient despite the elevated rate environment, supporting a narrowing of credit spreads even as the rate level remained elevated.
The Bloomberg US Aggregate’s year-to-date return improved to -1.63% from -2.48% the prior week — the most significant single-week improvement in the index’s annual trajectory since Q4 began. For fixed income investors who have endured three consecutive negative-return quarters, the week offered a reminder that the asset class retains its flight-to-safety properties even in a period when its primary year-to-date headwind — rising interest rates — has not abated. The Bloomberg Global Aggregate Float Adjusted index gained +0.89% for the week and improved to -1.80% year-to-date, as international sovereign bonds also benefited from the risk-off tone. The Bloomberg US Agency index is now essentially flat year-to-date at -0.37%, and Bloomberg US Corporate Bonds are -1.82% YTD — significant recoveries from the -3%+ levels of two weeks ago. The bond market’s near-term outlook is binary: if the October FOMC delivers a surprise hike, the year-to-date improvement reverses rapidly; if the committee holds and signals December as the next decision point, fixed income’s Q4 recovery could extend.
Alternatives & Commodities
Gold declined -0.84% for the week — a counterintuitive result in a week when inflation surprised to the upside, geopolitical risk remained elevated, and equities sold off sharply. The metal’s failure to benefit from the convergence of its historically most supportive conditions reflects the complexity of the current gold market: the hot CPI print simultaneously created a safe-haven bid and renewed concern about additional Fed rate hikes, with the real yield implication of another tightening move offsetting the inflationary support. Gold’s year-to-date return deteriorated to -3.69%, giving back some of the prior week’s recovery. The pattern suggests that gold is currently more sensitive to the real rate and dollar implications of Fed policy than to inflation or geopolitical risk in isolation — a dynamic that may persist until the Fed’s forward guidance becomes sufficiently clear to reduce the uncertainty premium around the October and December meetings. The metal remains in a position where it needs both a reduction in rate-hike probability and a sustained geopolitical catalyst to re-establish the upward trajectory that characterized August’s extraordinary surge.
Energy surged +5.02% for the week — its second consecutive strong advance — as the combination of the hot CPI print, continued Hormuz physical constraints, and rising oil demand expectations pushed Brent crude higher and drove the sector’s year-to-date return to +55.90%. The energy sector’s year-to-date performance now stands as one of the most extraordinary in recent market history: a single sector gaining more than 55% in the first nine-and-a-half months of the year, driven entirely by a geopolitical supply disruption that has shown no sign of resolution despite repeated diplomatic signals. For context, Energy’s +55.90% YTD dwarfs the second-best performing sector, Information Technology, which has fallen to +22.10% after its worst week of the year. Real estate investment trusts (FTSE NAREIT Composite) gained +1.19% for the week as the flight-to-safety bond rally provided a degree of yield relief, improving the sector’s year-to-date return to +9.18%. REITs remain one of the clearest beneficiaries of the October-pause narrative: every basis point of yield decline from the risk-off bid translates directly into valuation support for a sector whose pricing is tightly coupled to the long end of the yield curve.
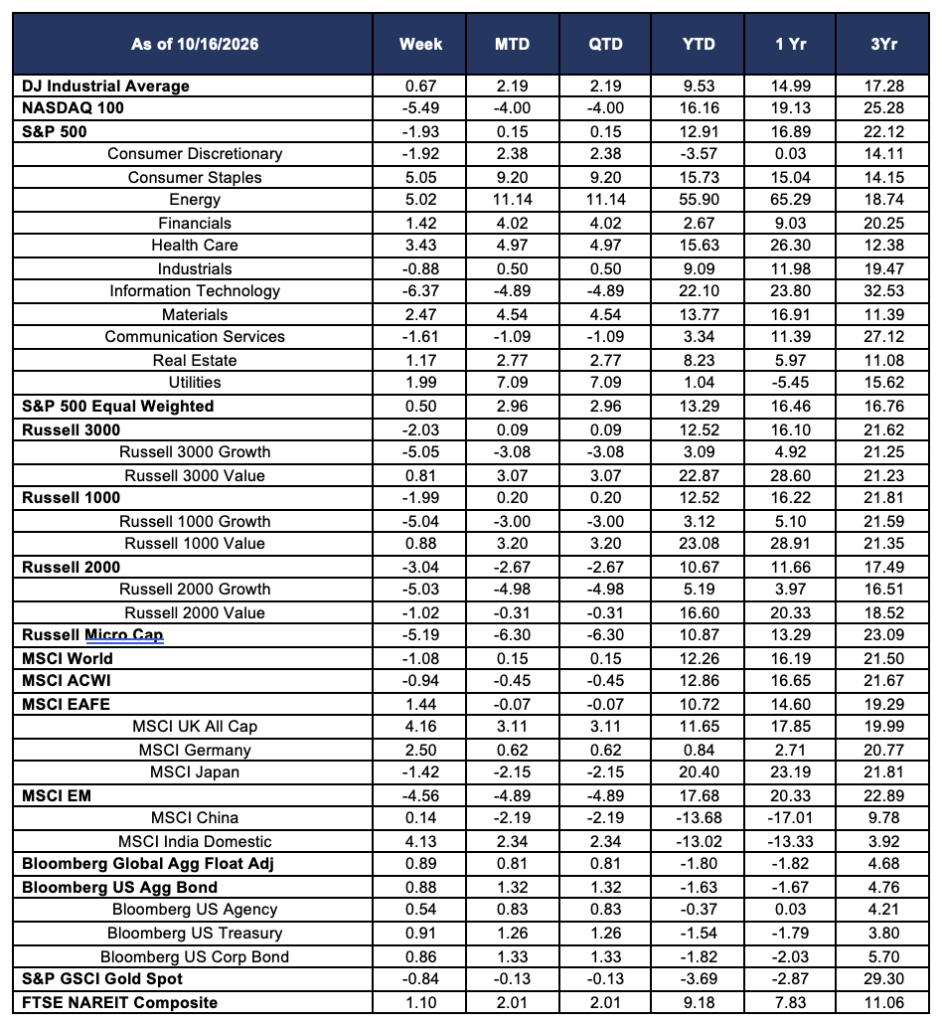
Source: Morningstar. Market data as of October 16, 2026. Past performance is not indicative of future results. The information provided is for educational and informational purposes only and does not constitute investment advice.