
Looking Ahead This Week: October 5, 2026
The September employment report has reshuffled the Federal Reserve’s calculus for the remainder of 2026 in a single morning. The +29,000 headline — a miss of more than 55,000 against consensus expectations, accompanied by a combined -60,000 downward revision to July and August — arrives less than three weeks after the FOMC’s unanimous September hike and its hawkish dot plot signaling another increase before year-end. Chair Warsh now faces the same dilemma that defined the July meeting, but with the additional complexity of having hiked into a labor market that has now printed two consecutive severely weak months: July’s revised +21,000 and September’s +29,000 bracket a single-month recovery in August that may prove to have been the exception rather than the trend. Futures markets moved immediately on Friday to price a substantially reduced probability of a November hike, and Treasury yields pulled back from their multi-decade highs. The Fed is not yet in a position to declare a pause — the dot plot was released barely three weeks ago — but the September employment data significantly narrows the path toward a second 2026 hike.
The week ahead will extend Q4’s opening week into what is likely to be a pivotal period for policy expectations. September CPI, due mid-month, will be the next critical data input: with Brent crude trading well above $90 per barrel despite the Strait of Hormuz diplomatic signals from the United Nations General Assembly, the headline print faces meaningful upward pressure even as wage growth decelerated sharply to +3.0% annually — the slowest reading since 2021. The Q3 earnings season is beginning in earnest, with early reporters showing an 85% beat rate and approximately 31% year-over-year earnings growth — figures that provide a fundamental counterweight to the policy uncertainty. Information Technology’s year-to-date return has now surpassed +30%, and the NASDAQ 100 stands at +22.60% for the year: the AI monetization story that drove this quarter’s dominant equity theme is about to be tested against actual Q3 reported results.
Economic Data and Market Highlights: Week of September 28, 2026
Macro Backdrop
The week of September 28 was defined by the intersection of two powerful and opposing forces: surging Treasury yields that drove 10-year rates to their highest levels in more than two decades in the early sessions, and a Friday employment report so weak that it moved the market’s entire rate-hike probability distribution in the span of a morning. In the first three sessions of the week, the bond market continued its Q3 selloff — carrying the momentum of the FOMC’s September hike and the dot plot’s implicit promise of more — with the 10-year yield pressing near and briefly above 5% at multi-decade extreme levels that had not been seen since the early 2000s. Treasury yields at those levels represent a genuine constraint on asset valuations across virtually every rate-sensitive category: utilities, real estate, long-duration bonds, and international markets all faced headwinds from the domestic yield environment. Gold, which had declined sharply in the weeks following the Hormuz diplomatic optimism, continued its deterioration as rising real yields compressed the metal’s near-term appeal — its year-to-date return sinking to -4.12% through the week.
The September nonfarm payrolls report, released Friday October 2, was the week’s defining moment: +29,000 jobs, compared with a consensus expectation of +84,000, accompanied by a -60,000 combined downward revision to the prior two months and wage growth deceleration to +3.0% annually — the slowest since 2021. The unemployment rate ticked higher to 4.2%. The market’s immediate reaction captured the policy implications precisely: S&P 500 futures surged, Treasury yields declined, the dollar fell, and traders moved rapidly to reprice the November FOMC meeting away from the hike that the September dot plot had implied. The data creates a stark narrative challenge for the Fed: it hiked unanimously in September on the strength of the August payroll rebound (+162,000), and now faces a September print that matches July’s weakness — a pattern that looks less like temporary softening and more like a structural deterioration in labor demand. The Strait of Hormuz’s promised seven-day reopening, signaled by Iran at the United Nations General Assembly the prior week, did not materialize on schedule, and oil prices remained elevated, leaving inflation dynamics complex regardless of the employment trend.
Domestic Equities
The S&P 500 gained +0.94% through Q4’s opening sessions (October 1-2), anchored by a Friday surge following the weak jobs report that provided the most meaningful rate-relief catalyst of the post-hike period. Information Technology led the advance at +1.84% and extended its year-to-date return to an extraordinary +30.74% — the first major S&P 500 sector to exceed 30% for 2026. The NASDAQ 100 gained +1.32% and stands at +22.60% year-to-date, approaching levels that would make it one of the best-performing years for large-cap technology in the post-financial-crisis era. Industrials advanced +1.79% and Consumer Discretionary gained +1.23%, both benefiting from the Friday jobs-driven relief rally that reduced borrowing cost expectations for capital-intensive and consumer-facing businesses. The Dow Jones Industrial Average gained +0.54% through the opening sessions, a modest result that reflects the index’s heavier weighting toward traditional value-oriented businesses that face more direct exposure to the sustained-high-rate environment that characterized most of the week before Friday’s reversal.
Health Care was the week’s most significant underperformer at -1.32%, consolidating after its outsized Q3 performance (+7.97% for the quarter) as investors rotated from August’s defensive healthcare positioning back toward cyclical and technology names in light of the jobs report. Communication Services fell -0.32% and Consumer Staples slipped -0.03% as defensive sector rotation reversed modestly on the risk-on tone from the payroll miss. Financials gained only +0.18% and are now -1.12% year-to-date — a negative annual return through nine months that reflects the sector’s compressed position between two competing forces: the theoretical benefit of higher net interest margins from rate increases, and the growing concern about credit quality deterioration and reduced loan demand in an economy where the labor market is sending increasingly mixed signals. Utilities gained +0.99% but remain deeply negative year-to-date at -4.72%, a figure that captures the cumulative damage from 2026’s rate environment despite Friday’s modest relief. The S&P 500 Equal Weighted index gained +0.84%, a result nearly identical to the cap-weighted index — an unusual convergence that reflects the broad Friday rally distributing gains more evenly than the tech-concentrated moves that have characterized most of 2026.
International Equities
International developed markets were broadly weaker through Q4’s opening sessions, with MSCI EAFE falling -0.96% as the dollar’s strength during the week’s early high-yield sessions weighed on international returns for U.S.-based investors, and Friday’s dollar reversal provided only partial relief. MSCI UK All Cap declined -1.63% and MSCI Germany fell -0.58%, pushing Germany’s year-to-date return into negative territory at -0.36% — a figure that reflects the persistent structural headwinds of elevated European energy costs, dollar strength, and weakening industrial demand that have weighed on Europe’s largest economy throughout 2026. MSCI Japan slipped -0.43% through the opening Q4 sessions but retains one of the strongest year-to-date returns among major developed markets at +22.52%, driven by the compounding of structural corporate governance reform momentum, yen dynamics, and the country’s relatively insulated position from the Hormuz supply shock compared with other large energy importers.
Emerging markets eked out a modest +0.24% gain (MSCI EM) through Q4’s opening sessions, though the underlying picture was considerably more volatile. MSCI China declined -1.78% and its year-to-date loss has deepened to -13.32%, with the trailing twelve-month return deteriorating to -20.84% — a figure that underscores the severity of China’s equity market challenges in 2026. The combination of an unresolved property sector overhang, persistent geopolitical risk premium, and the structural energy import cost burden from the Hormuz disruption continues to weigh on Chinese equity valuations despite periodic policy stimulus. MSCI India Domestic fell -1.38% through Q4’s opening sessions, and its year-to-date loss has widened to -16.18% — making it by a growing margin the worst-performing major equity market of 2026. The data reflects both the energy import cost burden that has flowed through India’s current account and currency, and the domestic inflationary pressure that has forced the Reserve Bank of India to maintain restrictive monetary policy even as the economy faces headwinds from elevated global rates.
Fixed Income
Fixed income markets posted a modestly positive Q4 opening at +0.05% (Bloomberg US Aggregate) through October 1-2, as Friday’s weak jobs report provided the first meaningful catalyst for yield relief since the FOMC’s September hike. Bloomberg US Treasuries gained +0.03% and the Agency index added +0.05%, with yields declining from their multi-decade highs as traders rapidly repriced the November FOMC meeting following the payroll miss. The week’s bond market narrative is most vividly told through what happened on either side of the report: in the first three sessions, yields pressed toward and beyond their recent highs as the post-hike momentum from Q3’s final days continued into Q4; on Friday, the payroll miss drove a sharp yield reversal that provided relief for duration assets. The Bloomberg US Aggregate Bond Index’s year-to-date return stands at -2.86% through October 2 — a persistent negative that reflects the cumulative damage of 2026’s rate environment — but the Friday jobs report represents the most credible near-term catalyst for a fixed income recovery that the market has seen since August’s brief labor-market-driven bond rally.
The Bloomberg US Corporate Bond index fell -0.01% through Q4’s opening sessions and its year-to-date return has deteriorated to -3.13% — the largest annual decline among the major fixed income categories we track. Corporate bonds face the dual headwind of duration exposure to rising Treasury yields and credit spread widening as investors reassess borrower health in an economy where the labor market is weakening and the Fed’s forward guidance — despite the Friday payroll shock — has not yet pivoted. The Bloomberg Global Aggregate Float Adjusted index fell -0.11% through Q4’s opening and is -2.69% year-to-date, reflecting the global nature of the rate environment that the Fed’s September hike and hawkish dot plot reinforced for central banks tracking U.S. policy. The September jobs report, if not revised away in subsequent months, meaningfully changes the calculus for the remainder of 2026 — and for bond investors who have endured three consecutive negative-return quarters, the question heading into Q4 is whether Friday’s catalyst can mark a genuine turning point.
Alternatives & Commodities
Gold declined -0.58% through Q4’s opening sessions (October 1-2), though the metal faced significantly more pressure in the week’s earlier sessions as Treasury yields pressed toward multi-decade highs. The full week’s deterioration pushed gold’s year-to-date return to -4.12% — its worst level of 2026 and a striking reversal from the +10% peak reached in mid-August following the July labor market shock. Gold has now retraced virtually the entire summer’s safe-haven surge, driven by the combination of rising real yields that compress the metal’s relative attractiveness, dollar strength associated with the U.S. rate environment, and fading Hormuz-driven geopolitical risk premium as the Iran diplomatic track — however unreliable — introduced a scenario in which the year’s defining supply disruption might eventually normalize. Friday’s jobs report and the associated yield decline provide a potential near-term catalyst for gold: a weaker labor market that reduces additional rate hike probability simultaneously reduces the real yield headwind and the dollar tailwind that have weighed most heavily on the metal since late August.
Energy gained +2.13% through Q4’s opening sessions, rebounding from the prior week’s -2.99% decline that had followed Iran’s UN General Assembly reopening signal. The Hormuz waterway remained physically constrained through the week, and the promised seven-day reopening timeline passed without tangible progress toward normalization — a pattern that has repeated throughout 2026 as diplomatic signals have consistently outpaced physical reality in the Strait. Energy’s year-to-date return of +43.26% remains by a substantial margin the best sectoral performance of 2026, and the sector’s trajectory heading into Q4 will be determined by the pace at which the Hormuz situation evolves: a genuine reopening agreement would represent the sector’s most significant headwind; continued stalemate keeps oil prices elevated and the sector’s extraordinary annual gain intact. Real estate investment trusts (FTSE NAREIT Composite) fell -0.29% through Q4’s opening sessions and their year-to-date return stands at +6.72% — a positive figure that nonetheless reflects the significant compression experienced since Q3’s rate-driven deterioration, with the sector’s year-to-date trajectory now dependent on whether Friday’s jobs report and its implications for the Fed’s forward path can provide the yield relief that REIT valuations require.
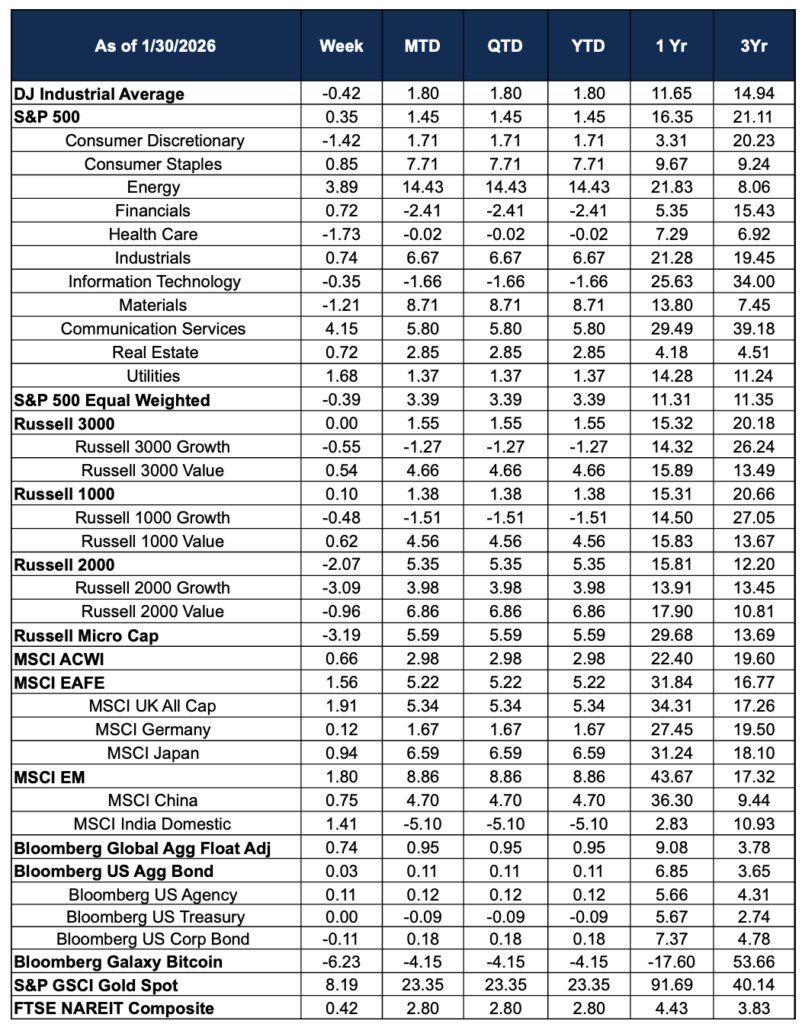
Source: Morningstar. Market data as of October 2, 2026. Past performance is not indicative of future results. The information provided is for educational and informational purposes only and does not constitute investment advice.