
Looking Ahead This Week: June 15, 2026
All eyes turn to the Federal Reserve’s June 16-17 FOMC meeting — Chair Kevin Warsh’s first rate decision at the helm — as investors look for clarity on the policy path in an environment of persistent inflation and resilient growth. With May CPI printing at 4.2% year-over-year (the highest reading since April 2023) and the labor market adding a well-above-consensus 172,000 jobs in May, the committee is widely expected to hold rates steady at 3.50–3.75%. The more consequential output will be the updated Summary of Economic Projections and the dot plot, which markets will scrutinize for any shift in the median rate path — specifically whether officials have formally pushed projected cuts into 2027 and whether any members have penciled in a hike.
Chair Warsh’s press conference will be closely parsed for tone. His early signals as chair have leaned hawkish, and a press conference that emphasizes the Fed’s inflation-fighting resolve could further compress multiples for long-duration growth stocks. Separately, U.S.-Iran ceasefire negotiations remain fluid — any formal agreement or breakdown in talks could move energy prices sharply and alter the inflation outlook. The rotation from mega-cap technology into small-cap value and cyclicals that intensified this week bears watching: if it continues, it would represent a meaningful structural shift in market leadership heading into the second half of 2026.
Economic Data and Market Highlights: Week of June 8, 2026
Macro Backdrop
The week’s dominant macro story was the May CPI report, released June 10, which showed consumer prices rising 4.2% year-over-year — the highest reading since April 2023 and above the 3.9% consensus estimate. The monthly gain of 0.6% was again driven heavily by energy, with the energy index up 3.9% for the month and 23.5% over the prior year, reflecting the sustained impact of the Strait of Hormuz supply disruption. Core CPI, which excludes food and energy, rose 0.2% monthly and 2.9% annually — incrementally more encouraging than the headline, but still well above the Federal Reserve’s 2% target. The report effectively eliminated any remaining market expectation of 2026 rate cuts; futures markets now assign meaningful odds to a December rate hike, with the first cut priced no earlier than mid-2027 at the soonest.
The hot inflation print arrived days before the Fed’s June 16-17 FOMC meeting — Chair Warsh’s first as head of the committee — reinforcing the expectation of an extended hold and increasing scrutiny of the dot plot for any formal tightening bias. Despite the challenging headline inflation data, markets managed a modest recovery across most asset classes as investors rotated away from the concentrated mega-cap growth positions that had dominated the prior cycle and into a broader array of value, cyclical, and small-cap names.
Domestic Equities
The S&P 500 gained a modest +0.66% for the week, but the headline number masked a significant leadership rotation taking place beneath the surface. Growth-oriented indices declined — the Russell 1000 Growth fell -0.84% and Russell 3000 Growth fell -0.73% — while value indices surged: Russell 1000 Value gained +2.49% and Russell 3000 Value added +2.57%. The divergence was even more pronounced in small caps, where the Russell 2000 surged +3.93% and the Russell Micro Cap index rose +4.31%. The equal-weighted S&P 500 gained +1.91%, meaningfully outpacing the cap-weighted index, confirming that breadth improved even as technology leadership faded.
Materials was the week’s top sector at +3.00%, followed by Consumer Staples (+2.59%) and Financials (+2.04%). These results reflect the ongoing ‘Great Rotation’ of 2026 — a structural reallocation from richly valued mega-cap technology into cyclicals, domestically focused small-cap companies, and value-oriented sectors that had lagged during the prior AI-driven bull market. The valuation gap between large-cap growth and small-cap value had reached multi-decade extremes heading into 2026, and the combination of fading AI earnings momentum and rising rate expectations appears to be catalyzing a durable rebalancing. Communication Services extended its losing streak, declining -1.86%, while Information Technology gained a muted +0.53% as the sector attempted to stabilize following the prior week’s Broadcom-driven collapse. The NASDAQ 100 rose +2.35%, a technical bounce after its worst week in over a year.
International Equities
International developed markets turned in a modest positive week, with MSCI EAFE gaining +0.97%. MSCI UK All Cap rose +1.27%, supported by improving domestic economic data and some relief on energy costs as Iran ceasefire talks continued in the background. MSCI Germany declined -0.52%, as European growth concerns and a stronger euro weighed on export-oriented names. MSCI Japan was notably weak, falling -1.59%, as a strengthening yen pressured exporters and investors reduced risk in the context of the global rate-hike narrative.
Emerging markets were essentially flat on the week, with MSCI EM gaining just +0.04%. MSCI India Domestic recovered slightly at +0.70% but remains deeply negative year-to-date at -11.86%, reflecting the compounding pressures of elevated energy import costs and currency weakness. MSCI China continued to drift lower, falling -0.69% on the week and -8.82% year-to-date, as domestic economic headwinds and limited policy stimulus fail to attract meaningful international capital. Despite the flat week, MSCI EM retains its position as the leading major region year-to-date at +23.36%, anchored by strong performance from non-China emerging market economies.
Fixed Income
In a somewhat counterintuitive response to the hot May CPI print, fixed income markets posted positive returns for the week. The Bloomberg US Aggregate Bond Index gained +0.52%, and Bloomberg US Treasuries rose +0.44%, suggesting that some of the inflation shock had already been priced following the prior week’s yield spike on the stronger-than-expected jobs report. Bloomberg US Corporate Bond gained +0.55%, as credit spreads held relatively stable — a signal that markets are treating the current inflation environment as a supply-shock phenomenon rather than a sign of credit stress.
The global bond market also recovered modestly, with the Bloomberg Global Aggregate Float Adjusted Index rising +0.41%. While the weekly performance provided some relief, the medium-term outlook for fixed income remains constrained by the rate policy path: the Bloomberg US Treasury index is now essentially flat for the year (-0.03% YTD), and any formal adoption of a tightening bias at the upcoming FOMC meeting could reintroduce meaningful duration risk. Corporate bonds, at +0.62% year-to-date, continue to offer a more attractive return profile than Treasuries within the fixed income universe.
Alternatives & Commodities
Gold continued its sharp month-to-date retreat, declining -2.90% for the week and bringing its June loss to -7.71%. The metal is now -2.36% year-to-date — a remarkable reversal from its April highs — as the combination of a strengthening U.S. dollar, rising real yields, and a hot CPI print that pushed investors toward risk assets rather than safe havens compressed the gold premium. The gold selloff that began with the May jobs report has now erased all of gold’s 2026 gains, though the metal retains a strong trailing twelve-month return of +24.58%, reflective of the outsized safe-haven demand earlier in the year when geopolitical and inflation risks were at their peak.
Energy continued its slow pullback, declining -0.35% for the week as Iran ceasefire negotiations — while inconclusive — kept some supply optimism in the market. The Energy sector’s year-to-date return of +28.73% continues to make it the leading S&P 500 sector for 2026 by a wide margin, though its momentum has clearly decelerated from the extraordinary run seen in March and April. REITs (FTSE NAREIT Composite) gained +1.85%, benefiting from the modest improvement in the yield environment and value rotation dynamics, and are now up +15.86% year-to-date.
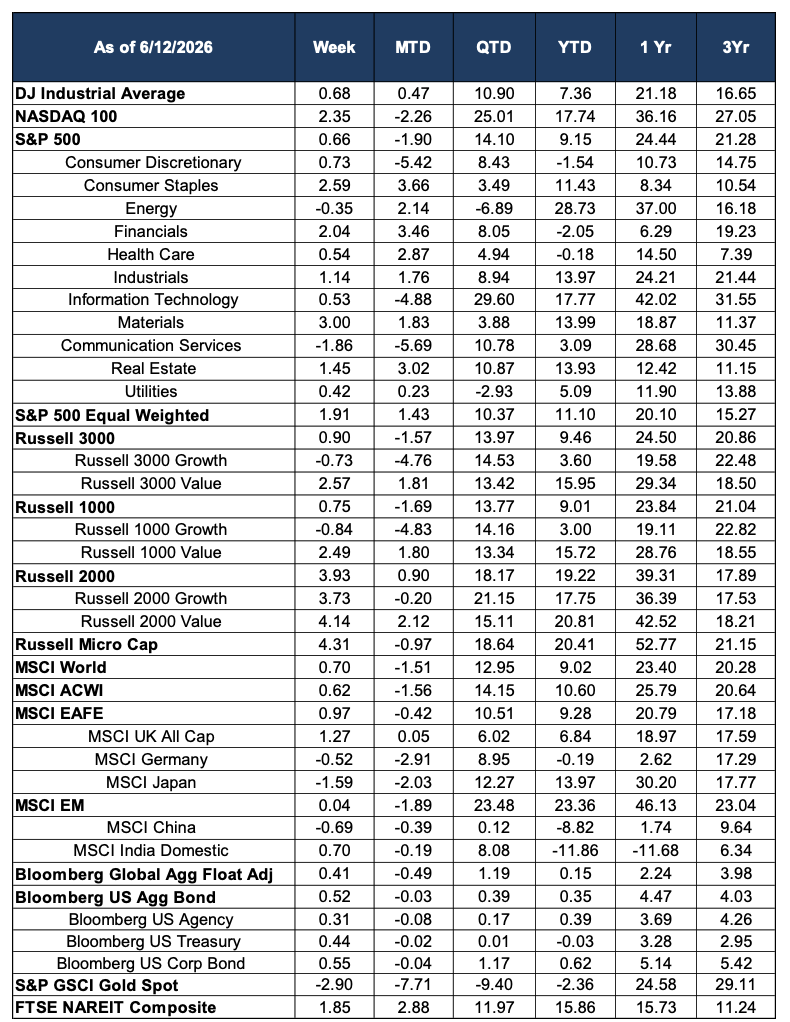
Source: Morningstar. Market data as of June 12, 2026. Past performance is not indicative of future results. The information provided is for educational and informational purposes only and does not constitute investment advice.