
Economic Data and Market Highlights
Global equity markets extended their powerful recovery during the week ending April 17, 2026, delivering a third consecutive week of gains and reaching a historic milestone: the S&P 500 closed above 7,000 for the first time in its history on April 15, finishing the week at 7,126.06. The index gained 4.55% for the week and has now swung from a year-to-date loss approaching 10% at its March low to a year-to-date gain of +4.47% — a recovery of more than 14 percentage points in just three weeks. The Dow Jones Industrial Average advanced 3.19% and is now up 3.35% for the year. The Nasdaq Composite capped its 13th consecutive winning session on Friday, its longest winning streak since 1992, while the S&P 500 posted its best three-week performance in six years.
Two forces drove the week’s gains in roughly equal measure: the continued de-escalation of the Iran conflict and a Q1 earnings season off to a meaningfully stronger start than investors had feared. On the geopolitical front, Iran formally declared the Strait of Hormuz open to commercial shipping during the ceasefire period, sending WTI crude oil plunging below $84 per barrel by Friday—down from a peak near $118 just weeks ago. The reversal in energy prices has been swift and significant, removing what had been the primary inflationary threat overhanging both markets and the Federal Reserve’s policy path. On earnings, early Q1 results across financials, technology, and industrials have exceeded expectations, with S&P 500 earnings growth tracking toward the high teens on a year-over-year basis.
Macro Backdrop: Energy Deflation and Earnings Lift the Outlook
The Iran ceasefire’s impact on energy markets has been the single most consequential macro development of the past two weeks. With WTI crude now below $84 per barrel — compared to levels above $112 just a month ago — the stagflation scenario that had dominated market discussions through much of Q1 has materially receded. The March CPI’s energy-driven spike to 3.3% year-over-year now looks more likely to represent a cyclical peak than the beginning of a sustained inflationary reacceleration, as the energy component retreats with oil prices. Core inflation’s measured pace of 2.6% remains consistent with a Fed on hold, and the prospect of one rate cut late in 2026 is still the base case, with some observers beginning to entertain the possibility of a slightly more accommodative path if energy disinflation accelerates.
The Federal Reserve meets April 28-29 against a backdrop that has improved considerably since its March meeting. Q1 earnings season has provided an additional layer of fundamental support. Major banks set the early tone: Bank of America reported $8.6 billion in Q1 profit, exceeding estimates, while Taiwan Semiconductor Manufacturing beat on both earnings per share and revenue. Overall, with approximately 10% of S&P 500 companies having reported, both the percentage of positive surprises and the magnitude of beats are running above recent averages, and full-year earnings growth estimates have been revised upward to the high teens. The notable exception was Netflix, whose shares fell more than 9% after-hours following Q1 results and an announcement that co-founder Reed Hastings will step down from the board.
Domestic Equities
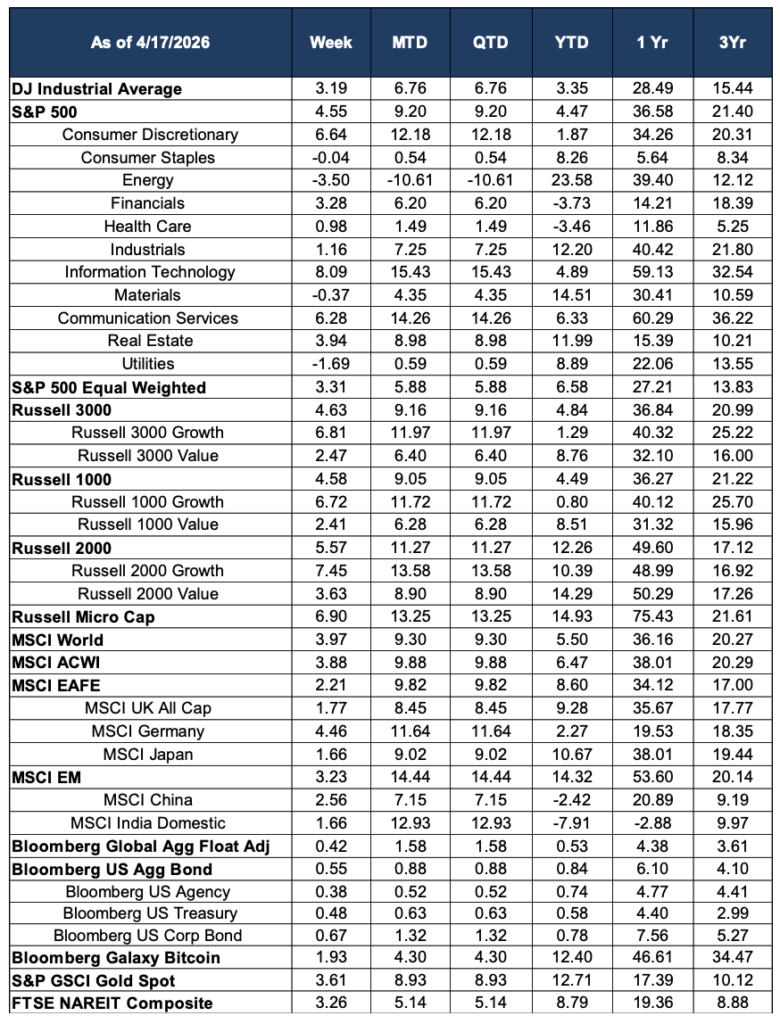
Sector performance this week reflected a decisive rotation into the growth and cyclical names that had been most pressured during the conflict-driven selloff. Information Technology led all sectors with a gain of 8.09%, extending its month-to-date return to an exceptional +15.43%—a dramatic reversal for a sector that had been one of the year’s laggards through March. Communication Services was close behind at +6.28% on the week and +14.26% month-to-date. Consumer Discretionary gained 6.64%, Financials rose 3.28%, Real Estate added 3.94%, and Industrials advanced 1.16%. The week’s gains were remarkably broad, with nearly every sector participating in the recovery.
Energy continued its correction, declining 3.50% on the week as oil prices fell sharply on ceasefire-related supply restoration. The sector is now down 10.61% month-to-date, a sharp reversal from its dominant Q1 position, though it retains a year-to-date gain of +23.58% that reflects the magnitude of its war-driven run. Utilities fell 1.69% and Consumer Staples were essentially flat at -0.04%, consistent with their typical underperformance in strongly risk-on environments. Materials declined modestly at -0.37%.
Growth stocks dramatically outpaced value this week across every capitalization tier, a reversal of the trend that had characterized much of Q1. Russell 1000 Growth gained 6.72% versus 2.41% for Russell 1000 Value. Small caps had an outstanding week: the Russell 2000 surged 5.57% and is now up a robust +12.26% year-to-date, while the Russell Micro Cap gained 6.90% and is up +14.93% for the year. The S&P 500 Equal Weighted index rose 3.31%, with the cap-weighted index’s outperformance driven by the outsized gains in large-cap technology and communication services.
International Equities
International equity markets continued to outperform on both a weekly and year-to-date basis. The MSCI ACWI gained 3.88% on the week and is now up 6.47% year-to-date, while the MSCI EAFE advanced 2.21% and has extended its year-to-date gain to +8.60%—nearly double the S&P 500’s year-to-date return of +4.47%. Germany was the strongest developed market constituent, rising 4.46%, while Japan added 1.66% and is up an impressive +10.67% year-to-date. The UK gained 1.77%.
Emerging markets continued their strong performance, with the MSCI EM advancing 3.23% on the week. The standout story of the past several weeks has been the magnitude of the emerging market rebound: the MSCI EM is now up +14.32% year-to-date, by far the best-performing major equity region globally, as oil-importing economies benefited disproportionately from the commodity price reversal. India recovered another 1.66% on the week, though the MSCI India Domestic index remains negative at -7.91% year-to-date, still digesting the steep losses from earlier in the year. MSCI China gained 2.56% but remains down 2.42% for the year.
Fixed Income
Fixed income markets posted modest but broadly positive returns as improving risk sentiment was partially offset by a modest backup in Treasury yields. The Bloomberg U.S. Aggregate Bond Index gained 0.55% on the week, pushing its year-to-date return to a positive +0.84%. Corporate bonds led, with the Bloomberg U.S. Corp Bond index rising 0.67% as credit spreads continued to tighten in the improving economic environment. U.S. Treasuries gained 0.48% and Agency debt rose 0.38%. The Bloomberg Global Aggregate Float Adjusted index advanced 0.42% and is now up 0.53% year-to-date. The constructive fixed income environment, alongside the equity rally, suggests a market pricing a soft-landing scenario with increasing confidence.
Alternatives & Commodities
Gold extended its year-to-date advance, gaining 3.61% on the week and pushing its year-to-date return to +12.71%, with a one-year gain now standing at 17.39%. The continued strength of gold in a risk-on environment—when it might typically face selling pressure—speaks to the structural nature of the current demand: central bank accumulation, geopolitical uncertainty premium that has not fully unwound, and long-term inflation hedging positioning all appear to be sustaining the rally. Bitcoin staged another recovery, gaining 1.93% on the week. The Bloomberg Galaxy Bitcoin index has now turned meaningfully positive year-to-date at +12.40%, recovering from a low of -23% earlier in the quarter. Real estate investment trusts continued their recovery, with the FTSE NAREIT Composite up 3.26% on the week and +8.79% year-to-date, benefiting from improved growth expectations and the pullback in energy inflation.
Looking Ahead
Equity markets are in a markedly different position than they were just three weeks ago. The S&P 500 at a record high above 7,100, a Nasdaq on a 13-session winning streak, and year-to-date returns across most major asset classes in positive territory represent a dramatic shift in the macro and market narrative. Three catalysts — the Iran ceasefire, the oil price reversal, and stronger-than-feared Q1 earnings — have combined to validate the case for staying invested through the volatility. The key question now is whether these tailwinds can sustain the rally or whether the market has moved ahead of the underlying fundamentals.
The Federal Reserve’s April 28-29 meeting is the next major scheduled event. With headline inflation likely to moderate sharply in the April CPI report given oil’s retreat, and with core inflation already tracking near 2.6%, the Fed has more flexibility than it did a month ago, though a near-term rate cut remains unlikely given the uncertainty that still surrounds the ceasefire’s durability. The two-week ceasefire window and the Islamabad peace talks will remain in focus; any breakdown in negotiations could reignite oil prices and quickly reverse the inflationary progress of recent weeks. Q1 earnings season continues to build, with a large number of S&P 500 companies reporting in the week ahead, and consensus estimates will be tested by management guidance on input costs, tariff exposure, and demand conditions heading into Q2.
Source: Morningstar. Market data as of April 17, 2026. Economic and news data sourced from CNBC, PBS NewsHour, TheStreet, FactSet, NBC News, and PBS. Past performance is not indicative of future results. This commentary is for informational purposes only and does not constitute investment advice.